
I started graphing linear inequalities at the end, with our Knittng Business. For day two, I gave them a foldable that we went over. This day we worked on graphing the lines, then picking and testing their “test points” in class. It went very well as I could refer back to the knitting example with almost every question.
7th – Graphing Inequalities Foldable pdf
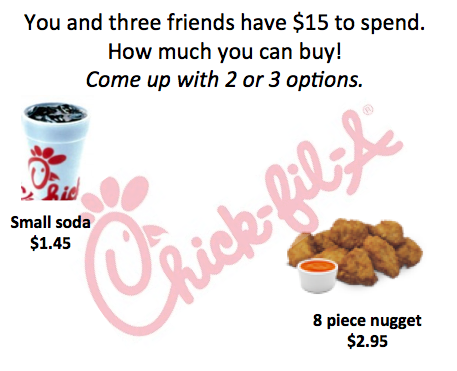 The next day I wanted them to learn how to write inequality equations. I used Chick-Fil-A for this example because they have all of their prices online. I showed them this slide and set them to work with a partner.
Once they came up with their food and drink combinations, I had them go to the board and enter their information onto a chart.
 Once their information was all on the board, I asked them to try and write an inequality for this information. Some groups got it right away. For those that struggled, I gave hints. First, I put the <= 15 on the board between chicken and total. That was all most groups needed. I then asked them HOW they calculated their total. Almost every student was able to write the equation. It was fantastic! I think that the table really helped them visualize the equation. I had not put in the total column before today – but it was key!
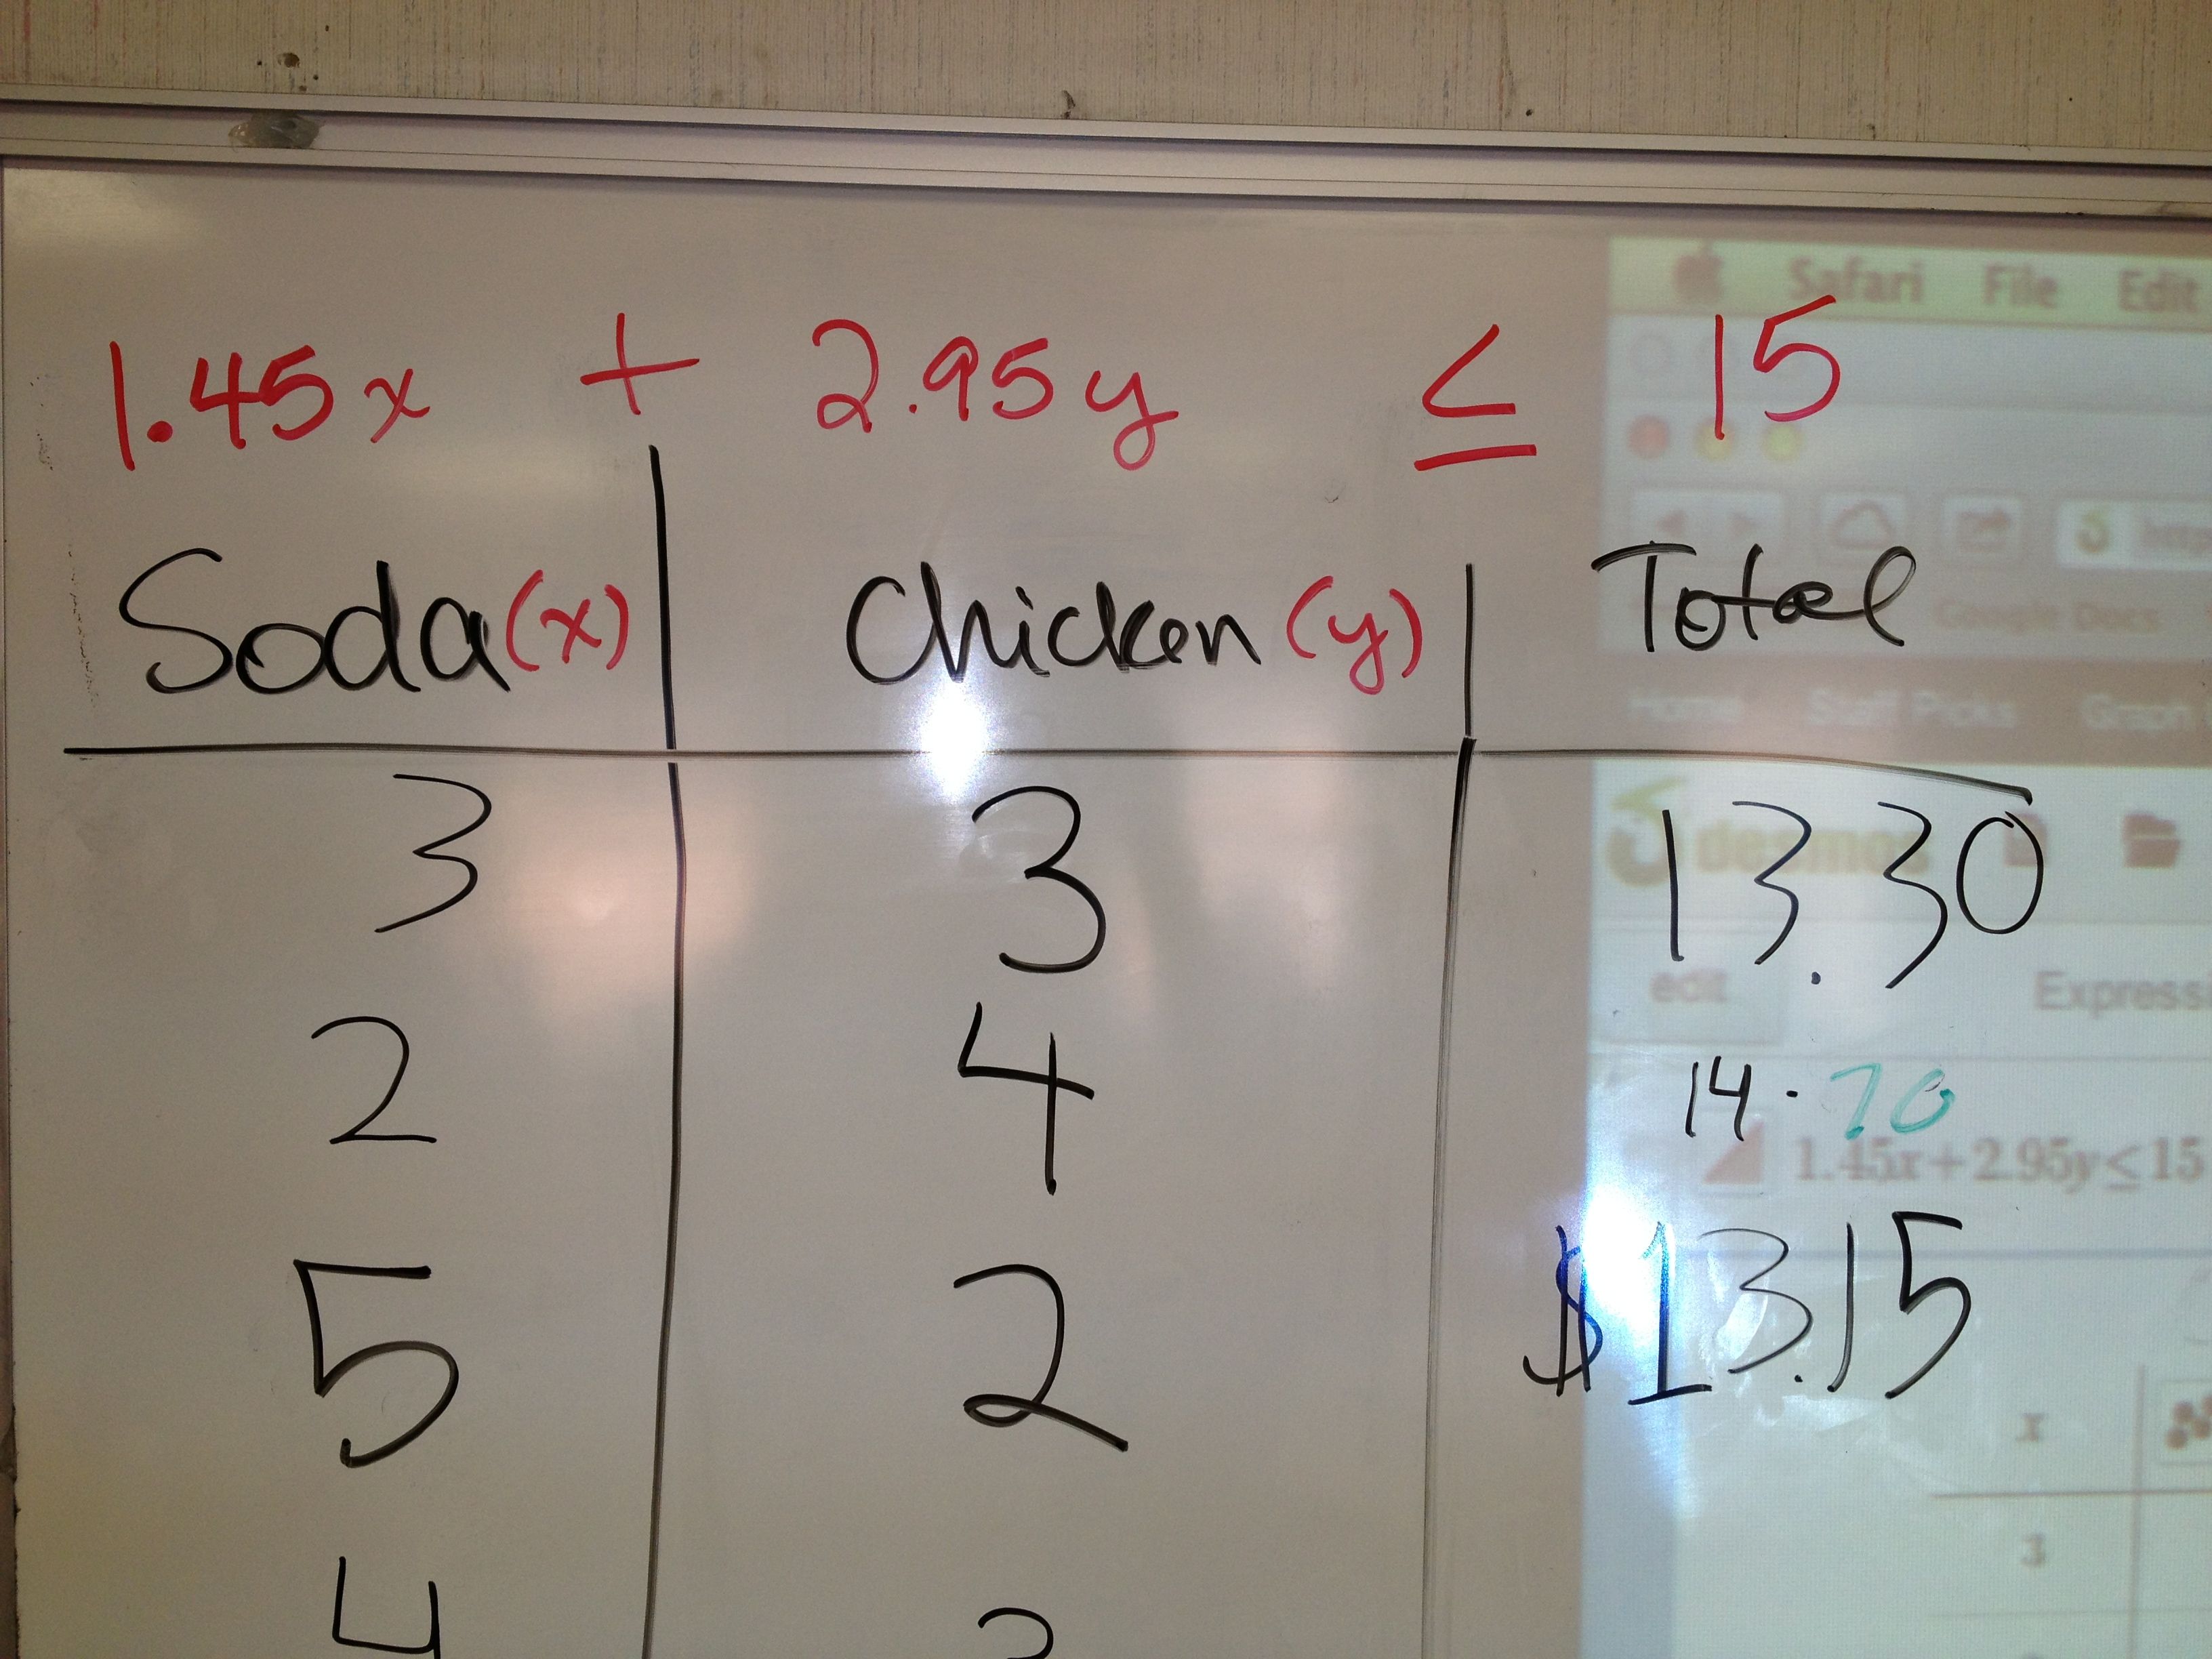
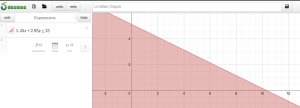
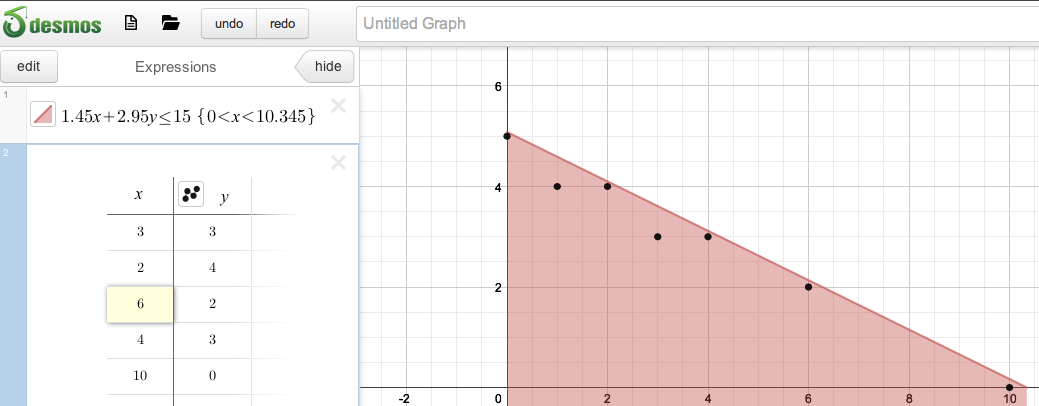
After we wrote the equation we went to Desmos.com and entered the equation with the shading. They love that.
After that, we added a table and then entered all of their food and drink combinations! They noticed that all of the combinations that we entered were actually “test” points. They also saw what it really meant to use a test point and why it was necessary. One group in each class had a wrong answer so they even got to see what happens when you shade one side and then pick a combination that doesn’t work! It was another day of “math-a-magic”!


I love this! I’ll keep it in mind when we get there!
Wonderful idea. Thank you so much for sharing! My kids are struggling with the shading steps and I think this will really help them!
LOVE THIS! I’m so using this for helping my students with constraints. 🙂 You are awesome!
I am definitely using this-thanks Julie!