Math-magic for Solving Multi-Step Equations

I don’t know why it took me so long to get on this band wagon.  DON’T be stupid like me and say, “I’ll get to it.”  Read all about it and decide now to do this with your students next year!

Screen Shot 2014-05-20 at 10.49.20 PM

Magic Tricks for solving equations is brilliant.  Not only is it very fun for the students, it makes learning how to solve multi-step equations very easy for them to understand.  It’s brilliant.  I read all about it on Dan (week 3) and Sadie’s blogs.  Go and read them to get the entire picture, especially since I harassed Sadie to blog about it forever!  Thanks Sadie!

I teach my students one-step equation solving with my silly “monster math” first.  Then, we start the magic tricks.  After just one lesson they are hooked.  My homework the first night is to make up your own magic trick and try it on someone at home, preferable a younger sibling!  This year, a student even videoed this and sent it to me.  See how fun this is?

After the first day, I teach them how to do more complicated equations that should fool even their older siblings and parents.  It is all about simplifying algebraic expressions. This is also a great application of the distributive property.  They can actually see when and why it makes sense to use parenthesis in an algebraic expression.  I love fun lessons that have it all!

Barbie Bungee 2014

What a difference a year makes!  My current students saw all of the Barbie Bungee action from the sidelines as 6th graders last year.  They have been asking me ALL YEAR LONG when we were going to do Barbie Bungee.  This build up was terrific!  Once they knew Barbie Bungee had arrived, they were begging for math class.

After all of the build up, my students took Barbie Bungee very seriously this year.  I make it a competition, and they all wanted to WIN.  They did multiple test drops, they measured carefully, and they drew beautiful graphs.  I did not teach them about the line of best fit, but had them read about it here instead.  I told them whoever had the most accurate data and the best line would win the competition!  They were inspired to learn all about the line of best fit!

Again, I let them adjust their graph after the 90″ test jumps.  This year I was tougher on them, and would not let them test jump again until they fixed their graphs.

The big jump day was so exciting!  Students were yelling and screaming.  One group had a rubber band disagreement.  They calculated the number of rubber bands and wanted to put a half of a rubber band on so their estimate would be perfect.  They wanted to win.  However, we don’t do half rubber bands, so the great rubber band debate ensued. They  only agreed to put the last rubber band on seconds before the jump.  It was a deadly mistake, and their Barbie was the only one to crash.  It was a tragic (read great) learning lesson!

Please enjoy the pictures and the video.  I have so much fun with this project and making the video each year.  It is the best project I have ever done with my students!

My Procedure:

  1. Day 1
    1. Show students Bungee Jump videos on YouTube.
    2. Group students and have them come up with a company name, slogan, goals, and logo for their Barbie Bungee company.  Have them read about the line of best fit for homework.
  2. Day 2
    Give students the handout and let them do the test jumps and the graph.
  3. Day 3
    1. TEST DROP day from 90″.  Students adjust their graphs if needed, and get to add a data point to their graph and adjust their line of best fit if needed.
    2. Re-drop if needed once graph is completed.
    3. Estimate how many rubber bands they will need to drop from 160″ and then attach those rubber bands to Barbie.
  4. Day 4
    1. JUMP DAY – Finish putting rubber bands on Barbie and then JUMP!
    2. Go to Alcula, enter their points, and see the linear regression equation, as well as how many rubber bands they SHOULD have used.  Screaming ensues on this day as well.
  5. Day 5
    Talk about the equation of a line.  Have them speculate what slope means, what the y-intercept means.  Blow their minds!  🙂

Kinesthetic Algebra – Making Abstract Variables Concrete

If you haven’t signed up for Explore the MathTwitterBlogosphere initiative, YOU SHOULD.  Because, as Tina said best,

No matter how much time I spend online, I’m always happening upon new parts of our awesome math teacher community. Even yesterday, when we were planning the first few missions for this oh so exciting event, I learned about some sites I didn’t know existed. This is exactly why I am inviting you to join me on an exploration of the best parts of the internet – the Math Twitter Blogosphere.

Tina Cardone

Yes, this exact same thing happened to me on Sunday.  I got this idea from Emma McCrea.   I tweeted her immediately to tell her how much I enjoyed her lesson, and she tweeted back that she has signed up for Explore MTBoS!  Win-Win!

I gathered spaghetti, yarn, and dental floss cut into different lengths, colored index cards cut into squares and rectangles, foam cubes, and then more of these pieces taped to other pieces.  I dumped them into five bins.  This was actually pretty fun for me.

Notice and Wonder:

When the students came in, I gave each table group a Notice and Wonder form and a bin of stuff.  I told them nothing except, “Fill out the Notice and Wonder form with your group.” We have done Notice and Wonder many times before, so they got right to it.

IMG_5879

They were FABULOUS.  Groups had great questions for me such as, “Is this 2D or 3D?”.  They noticed the different size shapes, lengths, and combinations.  They wondered if they were 1D, 2D, 3D or all 3D?  They wondered if they combined shapes were 4D.  Many groups even started sorting them.  Great idea.

Sorting:

I then had the groups sort their objects however they wanted.  I did get a couple of interesting sorts, but almost almost all groups sorted the same way.  So they could see what I was seeing, I had all of the groups walk around and look at all of the sorts.  My crazy sorters were able to see how most of the groups had sorted.

IMG_5878


After sorting, they shared their notice and wonder.  I explained to them that ALL of the objects were actually 3D, but we were going to look at them as 1D (length), 2D (flat paper), and 3D (3D objects).  At this point, the kids all said, “Like Flatland!” and a connection was born.

After that I drew pictures of the objects on the board, starting with 1D and moving up to 3D.  We talked about how the lengths of all of our green string were close, but different sizes, and how we can use a variable to name an unknown length.  To make this more interesting, I let them name the unknown lengths.  This was a HUGE hit, and they picked funny names like Wormy (w) and Doofy (d).  As we picked more lengths, it was a great chat when they wanted to name a new length Wanda (w), but could NOT because we already had a w and it was NOT the same length.  It was a blast!

When we had progressed all of the way to the cubes, the kids noticed a pattern.  They noticed that the variables for the 1D objects had 1 as an exponent, some 2D objects had an exponent of 2, and some variable of the 3D objects had an exponent of 3.  I love it when magic happens.

To end up the first day, we discussed the difference between wormy + wormy and wormy times wormy.  I held two wormy strings together to illustrate addition of two lengths.  I also drew a 2×3 multiplication array to illustrate multiplication and make sure they were getting the difference.

They seemed to get it (and seemed to enjoy it).  Tomorrow, I am going to let them cut their own lengths from spaghetti and draw their own 1D, 2D, and 3D shapes.

The next day, I will do Emma’s great sorting activity!  It is at the bottom of the page.  I will let you all know how it goes!

Quadratic Frames – Totally Nguyening

If you teach middle school math or Algebra 1 and you are not reading Fawn’s blog, then you should.  I get all of my ideas and inspiration from her!

She posted a great activity about Quadratics and framing.  Please go read her post for instructions.  I wanted to post how I modified her activity for Pre-Algebra (using simple factoring instead of the quadratic formula).  I followed her instructions exactly, and modified four things.

  1. I teach Pre-Algebra so I made the problem easier for my students so that the numbers would be easily factorable and not need the quadratic formula.  As a result, my students were more easily able to discover the frame dimensions (sadly, they did not beg).  It did take most of them quite a while however and they appreciated when I finally showed them the math.
  2. I had my students draw their own picture on a 3×5 index card.  They could also take a picture and bring it in.  This way I didn’t have to find a picture for them, or print it and make copies, or cut it out.  (Yes, I’m lazy and they love being creative so it was win-win.)
  3. I used index cards so I wouldn’t have to cut up a bunch of paper to the perfect size.  Really Fawn, you are a saint.  I had my students draw the picture on 3×5 index cards, then I used 4×6 index cards for the frame.  I cut them down to 4×5 to make the border an even 1″ (see #1).
  4. I had them post the finish product on a half sheet of paper.  This way they could glue down the picture and the frame instead of using tape.  I am always short on tape.  Also, on the back of the picture is where we all “did the math”.

I am posting mainly to say THANK YOU for Fawn, and to share my students creations!  I am really into notebooks so I also included an idea for adding the work to the students notebook.

The Process:

The finished product:

On the back of their picture, we did the math.

IMG_5027

The Notebook Entry:

Notebook Entry

It's like a foldable!

It’s like a foldable!

Graphing Linear Inequalities – Day 2 and Foldable

I started graphing linear inequalities at the end, with our Knittng Business.  For day two, I gave them a foldable that we went over.  This day we worked on graphing the lines, then picking and testing their “test points” in class.  It went very well as I could refer back to the knitting example with almost every question.

7th – Graphing Inequalities Foldable pdf

Screen Shot 2013-02-22 at 2.40.25 PMThe next day I wanted them to learn how to write inequality equations.  I used Chick-Fil-A for this example because they have all of their prices online.  I showed them this slide and set them to work with a partner.

Once they came up with their food and drink combinations, I had them go to the board and enter their information onto a chart.

IMG_4797 Once their information was all on the board, I asked them to try and write an inequality for this information.  Some groups got it right away.  For those that struggled, I gave hints.  First, I put the <= 15 on the board between chicken and total.  That was all most groups needed.  I then asked them HOW they calculated their total.  Almost every student was able to write the equation.  It was fantastic!   I think that the table really helped them visualize the equation.  I had not put in the total column before today – but it was key! IMG_4798


After we wrote the equation we went to Desmos.com and entered the equation with the shading.  They love that.

Screen Shot 2013-02-21 at 2.07.22 PM

After that, we added a table and then entered all of their food and drink combinations!  They noticed that all of the combinations that we entered were actually “test” points.  They also saw what it really meant to use a test point and why it was necessary.  One group in each class had a wrong answer so they even got to see what happens when you shade one side and then pick a combination that doesn’t work!  It was another day of “math-a-magic”!

Screen Shot 2013-02-21 at 2.11.06 PM Screen Shot 2013-02-21 at 2.11.35 PM


Starting at the End (Linear Inequalities)

I can’t say it enough.  Begin at the end.  This is not how I learned when I was in school.  This is not how I used to teach (as recently as a couple of years ago even).  And this is still not how I always teach.  But, it is how I want and NEED to teach, every time.  I’ve been reading much about “real” and “application” problems in mathematics teaching lately.  The value of these problems is that it can make a lesson engaging.  Making a lesson engaging is one of the most important aspects of effective teaching.  If you do not get the students engaged, it will not matter if is an amazing application problem or whether or not students believe it is real.  If they are not engaged, they will not learn.  If they don’t know WHY they are learning the math (be it real, imaginary, or application) they won’t be invested.  If you just throw some new math lesson with a bunch of steps at them, they won’t care about it.  Sure, your good students will learn the steps, and they will even be able to regurgitate them back to you on the test.  But, they probably won’t care or remember it for long.  They won’t be fascinated, and they won’t like math.  Call me crazy, but as much as possible, I’M DOING THE MATH LAST these days.  And I am getting audible “Ah!” moments in class – from 7th graders!  As Ellie said in class on this day, “We just made math-a-magic!”

Enter linear inequalities.  For me, there is almost nothing worse than teaching graphing linear inequalities.  Even when students can graph, the test point alludes them, no matter how many times or how many ways I explain it.  It seems like such an abstract and foreign concept to them, especially at first.  Until now.  Thanks so much to Misty Carver for all of her ideas and links!

Our 7th grade students knit scarves for patrons of the Mooresville Soup Kitchen every year during the holidays.  To begin linear inequalities I proposed a business.  Our Woodlawn students were going to knit scarves and afghans to sell, and donate the proceeds to charity.

Screen Shot 2013-02-21 at 7.04.26 PM

I put them in groups to brainstorm what they would need.  They created lists and came up with great questions.  They generated a terrific list of things they would need.

  • Sale price
  • Cost of materials
  • How many
  • Amount sold
  • How much we need to sell to break even
  • Knitting needles
  • Cost of yarn
  • Seasonal (winter – need more)
  • How we are going to make (time)
  • How long to make
  • How many we are going to make
  • How much yarn it takes to make one afghan or scarf
  • Snacks!

Thanks to Google, we found out how much a skein of yarn costs, and how much yarn it takes to make an afghan (they knew how much yarn it took to make a scarf from experience).  They all have knitting needles, so we were able to take that out of our expenses.

I then told them that Woodlawn school would donate $840 dollars for supplies.  I had them come up with scarf and afghan combinations that they could buy for $840.  I also had them come up with a combination that amounted less than $840 (in case we had unexpected expenses or wanted to buy snacks), and a combination that was too much money.

Screen Shot 2013-02-21 at 8.28.30 PM

Once they had their combinations, we put them in three different tables on Desmos.com (my new favorite website!).  We made a table for combinations that equaled exactly $840, one for less than $840 and one for more than $840.  Desmos is an amazing tool as we were able to make each set of points a different color.

After we entered our numbers, I had the students tell me what they noticed and asked if they had any wonderings (thanks so much Max!).   Thanks to Desmo’s colors, it was easy to see that all of the combinations that equaled $840 created a straight line.  So, we connected this line.  After connecting the line, it was very obvious that combinations under $840 all fell under this line, and those above $840 were above the line.

Screen Shot 2013-02-21 at 8.28.15 PM


We wrote the equation of that line together and then I had them watch me while I changed the equals sign to the <= sign in Desmos.  There was an audible gasp in the room as the bottom filled in.  Students exclaimed, “Oh my goodness, EVERYTHING in the orange area works!” as it dawned on them what had happened.  They couldn’t wait to see how to do it themselves and really realized what was going on.

Screen Shot 2013-02-21 at 8.29.15 PM

Never before had “test points” seemed so obvious to them.  Test points were not just random points, they MEANT something, they told a story.  The next day, when we finally got to the actually inequality lesson, foldable, and then homework, the students really understood the need for a test point.  They also easily understood the horrific workbook word problem.  Honestly, even I still can’t believe how well this works.  It is truly, “math-a-magic”!

So please, if you can, begin at the end and save the math for last!

Thanks so much to Desmos.com for all of their help via Twitter!  They are an amazing, consumer friendly product and we use it daily in our class now.  I still can’t believe that it is free!

Barbie Bungee Follow Up – Be Careful When Using “The Recipe”

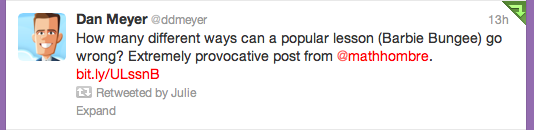
Last night, I saw this tweet from Dan,

Screen Shot 2013-02-02 at 12.14.39 PM

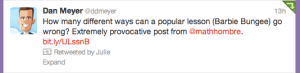
that led me to John’s post about his recent experience with the Barbie Bungee activity.  This is a great post, and there is a great discussion going on in the comments right now about how some activities can feel like a recipe and what we can do as teachers to change that.  Most of my projects for my first two years were recipes, and I have been trying desperately this year to change that!

Until this year, I had no idea how engaging student wondering, student questions, and student creativity would be for the actual students.  I had been reading about it via Dan’s blog any questions (#anyqs) and 3-acts.  As a teacher, I know that every lesson needs a great hook to fully engage students.  It was not until this summer however, that I actually got to experience this myself, as a student would, through Max’s “Wonderings” session at TMC12.  Now, for me “the hook” is not only the hook I would have used before (something interesting to them via an article, multimedia,…), but it also involves student wonderings and questions.  Since then I have observed that when students have time to wonder and develop their own questions, they become not only engaged but immersed in the activity.  Just by me talking (and instructing) less, and letting them wonder more, my students have naturally become more engaged and interested in the math.  They discover that they need to know more math to get to the next step, and this is when I give them instruction.  It is instruction during the project as they need it, not before.  Activities are projects are not afterthoughts, they are the lesson.  When they need the math to figure out their own questions, they work harder and longer, and they actually care about what they are doing.  When they create it, they own, and this is where I have seen them grow and learn the most!

I wanted to post this response on my my blog because I have touted the glory of the Barbie Bungee lesson.  I posted just the facts, my “recipe”, but I now realize that I left the most important part of my lesson – emphasizing the wondering.  With any activity, you have to be careful or it can end up just like a recipe.  Looking back, the projects that I have done for the past two years in my classes have been mostly recipes.  Since I experienced “wonderings” this summer, I work very hard to NOT let my activities develop as recipes.  Sometimes I am successful and sometimes I am not.  There is still so much I need to learn, and never enough time!

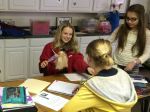
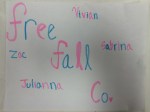
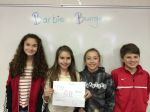
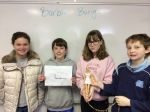
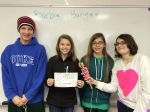
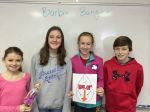
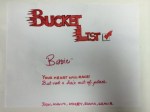
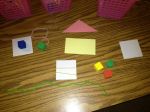
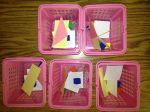
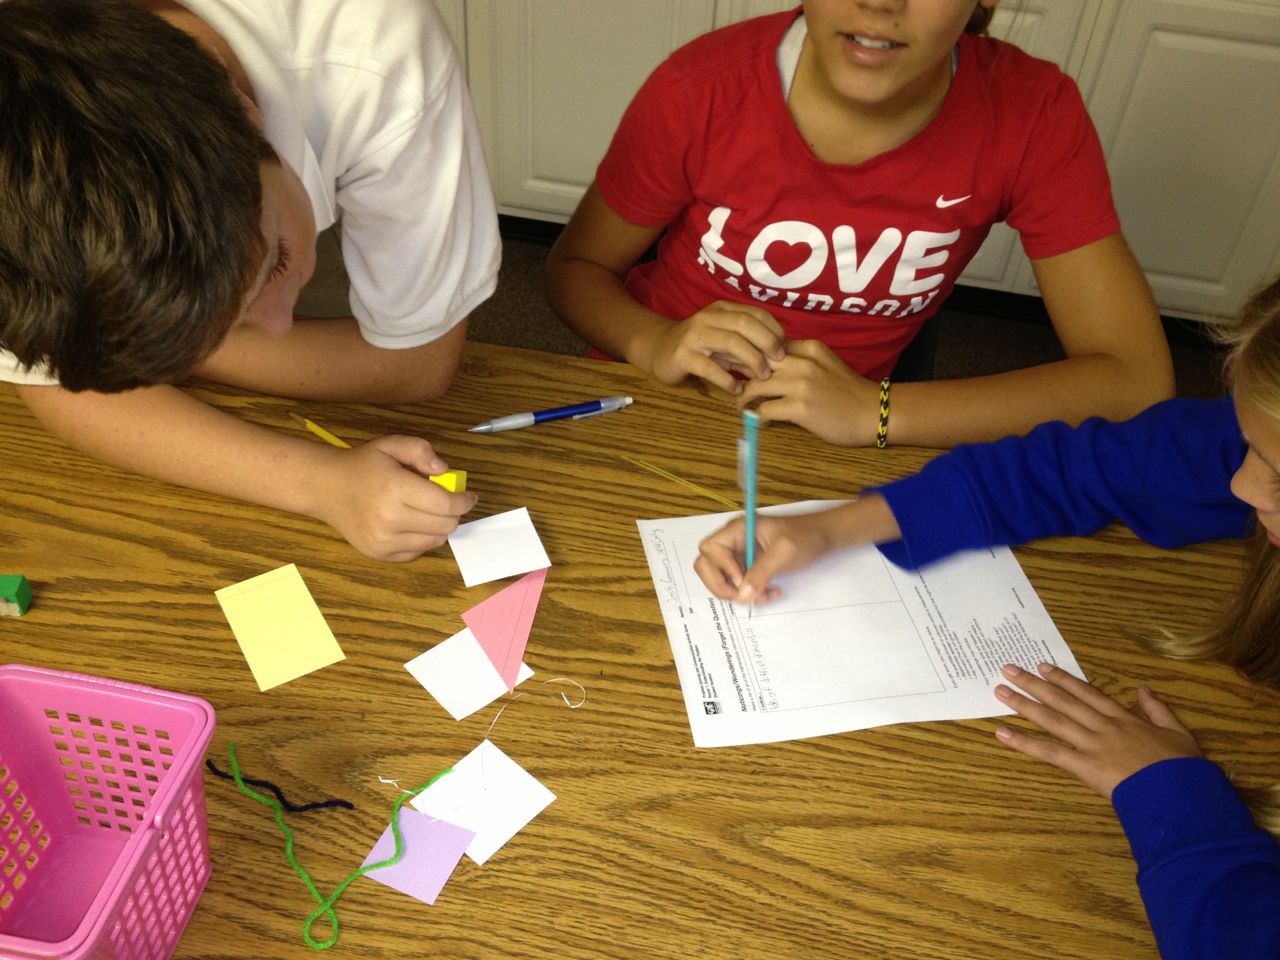
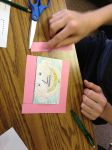
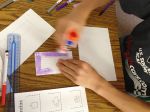
For Barbie Bungee,  I spent almost the entire first class period on “the hook”, “wonderings”, and student questions and creativity.  For the hook I showed them the Bungee Videos that they loved.  I had them create their own Barbie Bungee Companies but gave them very little directions other than, “Brainstorm things a successful company needs.”  From this they came up with company names, company slogans, and company goals.  Their goals were like the “any questions” I was hoping that they would come up with, similar to what I have seen come from a “First Act”.

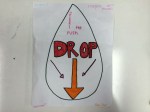
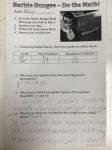
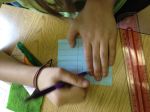
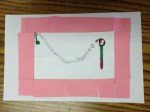
Only after they decided to give Barbie the biggest drop without killing her and started talking about how to estimate the number of rubber bands did I give them the instructions worksheet.  I probably could have done this without the worksheet.  But, I like that it had the Barbie Bungee slipknot instructions on it.  I love to give middle school students opportunities to read and follow directions and knew that consistent results (from consistent rubber band knotting) would help us draw better generalizations in the end.  Fawn is considering going without the worksheet next time around.  I’ll see how that goes before I jump.

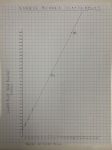
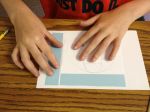
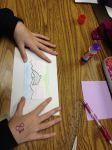
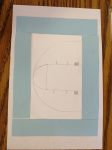
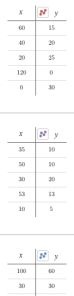
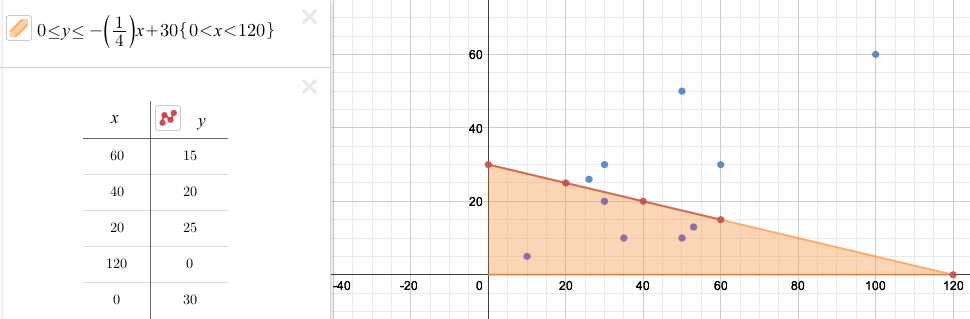
After collecting the data on the jumps, I did not have my students analyze the chart at all.  Instead, I had them plot their data.  When they did this, they noticed that it correlated and asked me how they could use this to make a better prediction.  I instructionally guided them and reminded them of the line of best fit.  This led them to their predictions for the test jump.

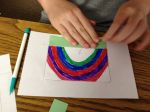
Another instructional opportunity came after the test jump.  When their Barbies hit the ground or fell short, they wanted to know why, and where they had gone wrong.  I encouraged them to put this new “test jump” on the data chart and on their graph.  This is when many noticed that they needed to adjust their line.  Almost every students second test jump was successful.  In all of this we did not calculate, we just predicted.

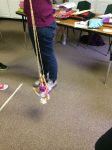
The “BIG JUMP” (13 feet), was more like the beginning of an “Act 3”.  Was their math correct?  It was exciting because the students loved seeing the Barbies jump – and loved to see their math work!  The finale was putting their data into the linear regression calculator, to see how many rubber bands they should have used and how close their predictions had come to the actual math.

I did not end this project with any giant math lesson.  In fact, this entire project for me was to create more wondering about linear relationships for our NEXT project where we would need to learn how to do the calculations.  Their wonderings were amazing.  They wanted to know things like, if they could predict Barbie’s fall with a linear equation, what else out there could they predict?  Does this work with anything else?  Does this work with everything else?  When does this not work?  It has led to three subsequent projects and we are starting a fourth in the next week.  In this, Barbie Bungee was not an activity in itself for my class, but the hook for all future linear equation work.

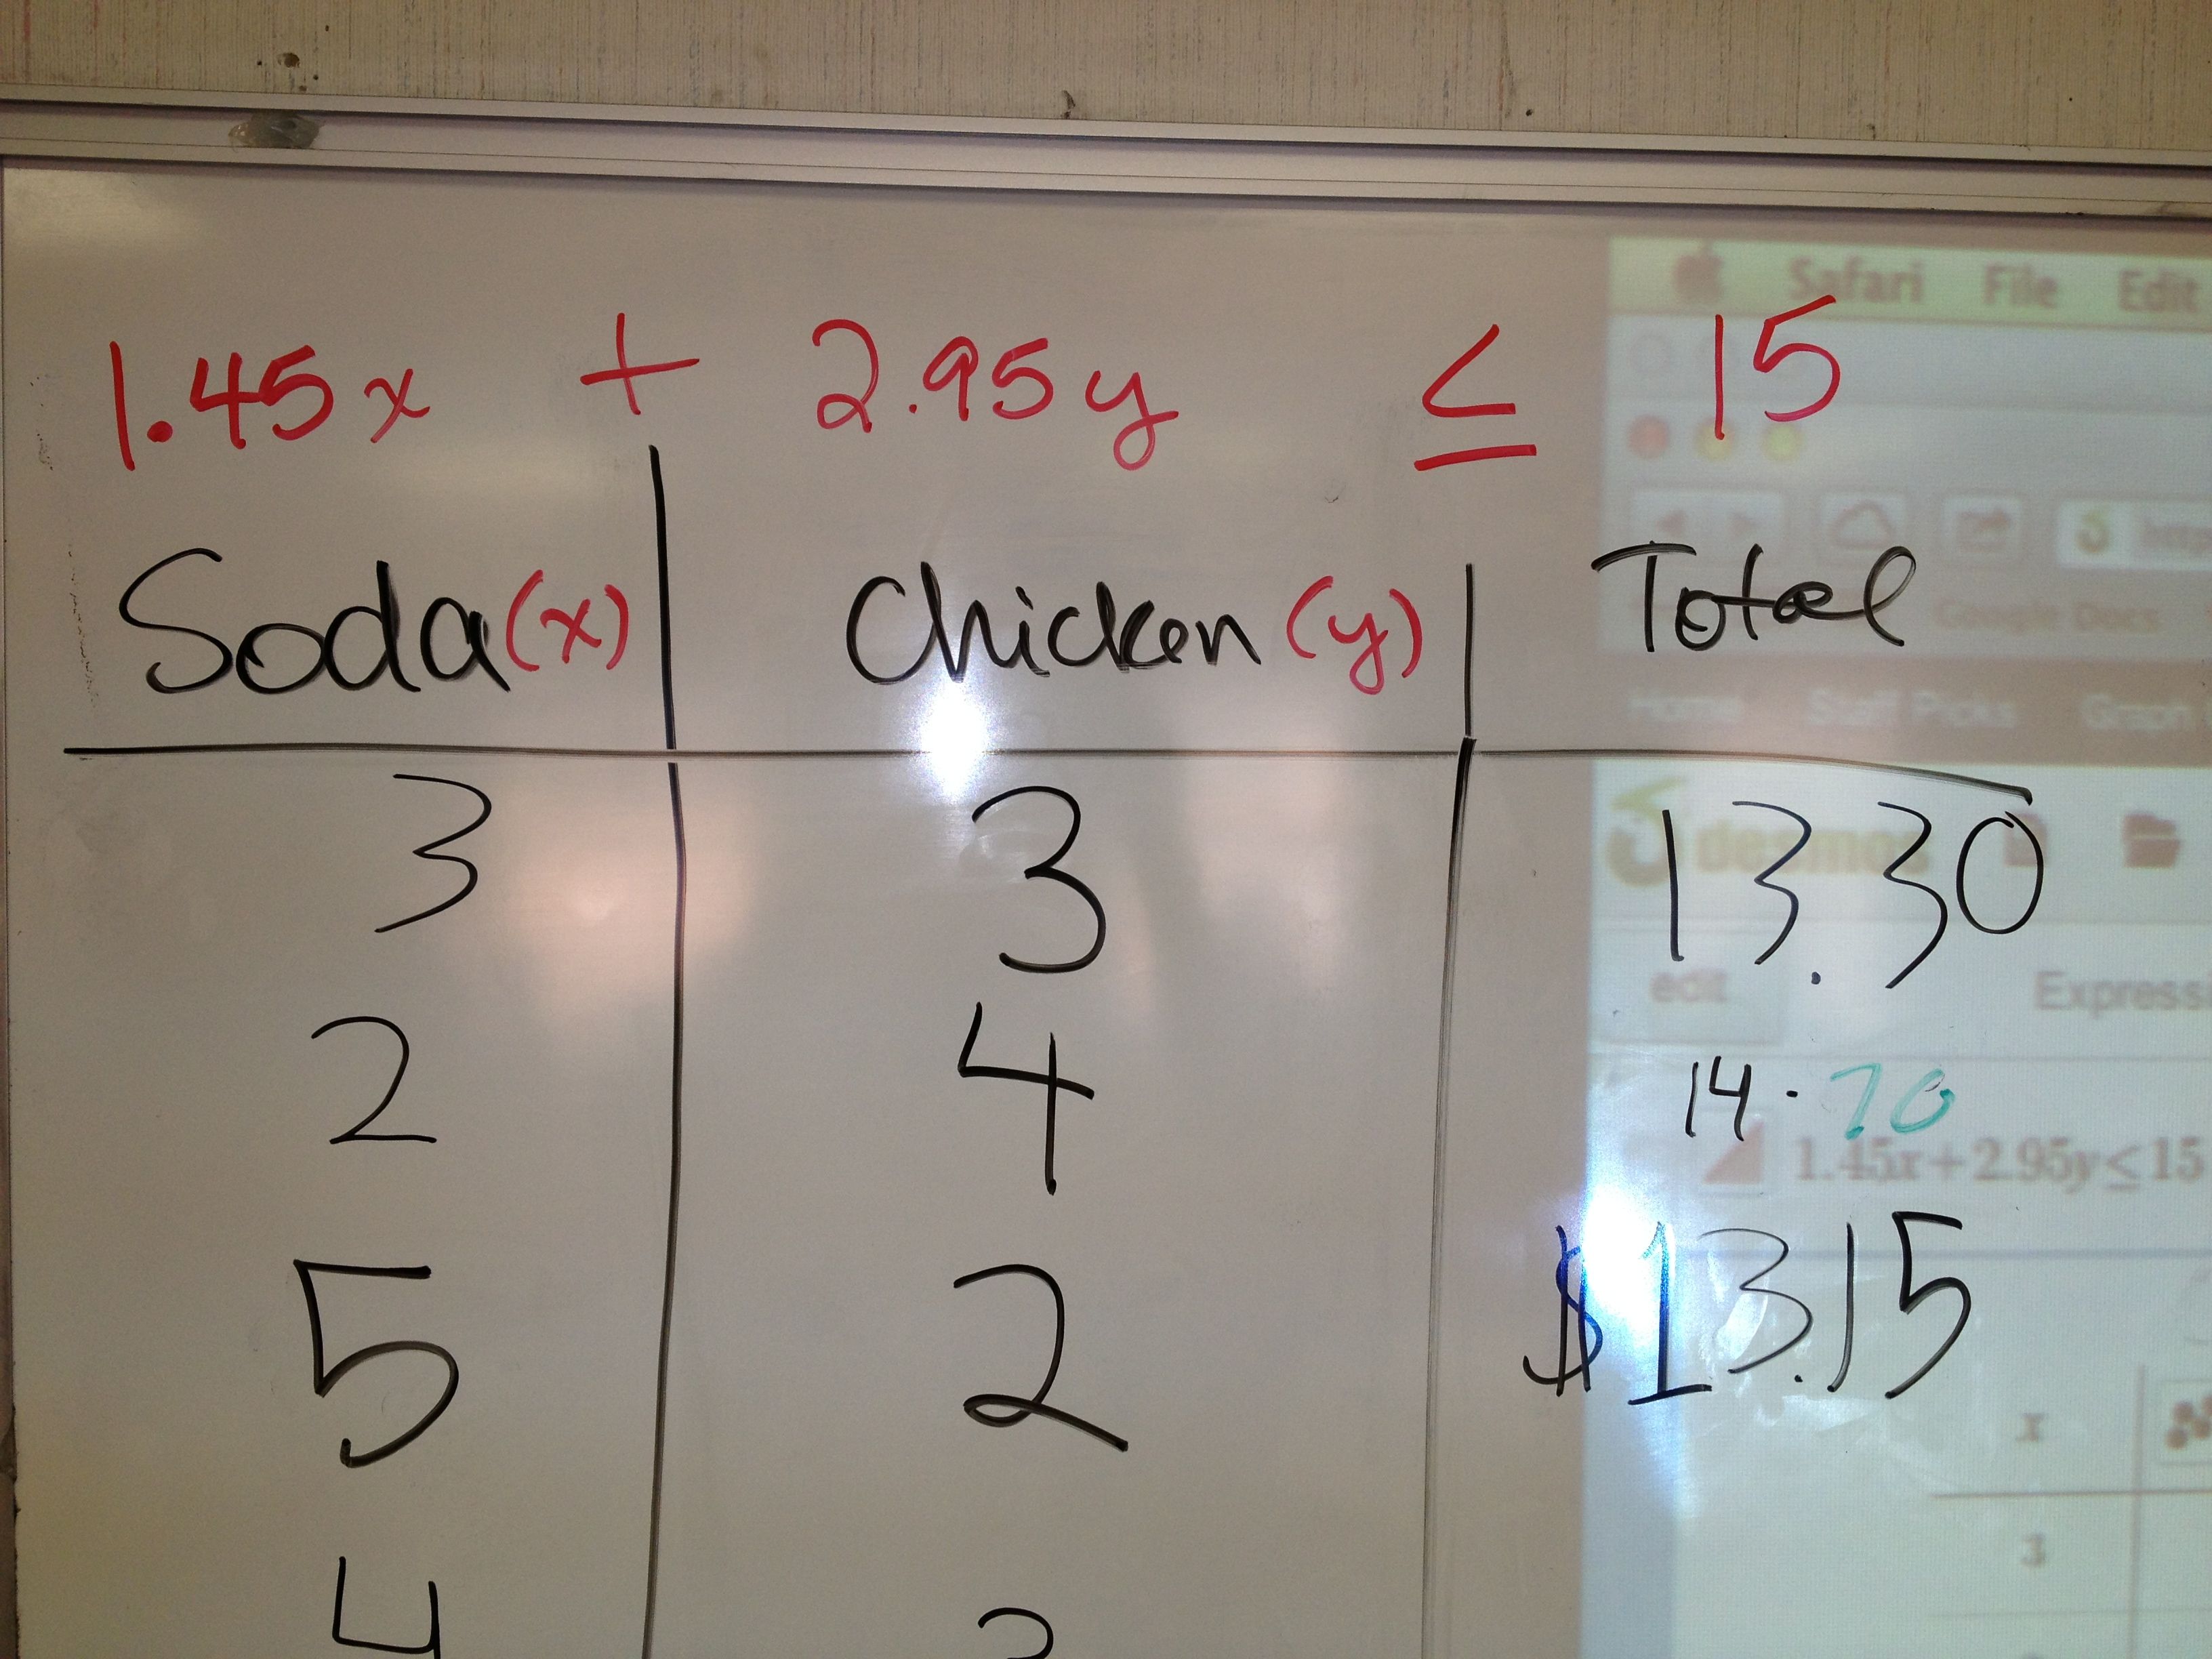
In a recent survey I gave my students, they said that they had the most fun with the Barbie Bungee activity, but that they learned the most “math” from our nutrition project (two projects later).  That, to me, is progress.

Barbie Bungee iMovies – Line of Best Fit

The Barbie Bungee iMovies are finally finished!  Barbie Bungee was my favorite activity of all times.  There is nothing more exciting then seeing seeing if your Barbie is going to come crashing to the ground.  The students learned so much and we ALL had a blast!

I’m not an iMovie expert, but I learned much more about it by making this movie.  The text moves way too fast – I wanted stationary text but it kept cutting it off.  My students told me they would help me with that.  They are only 12 years old, but much better at iMovie than I am!  I love them.

I told them they could make an iMovie if they wanted to – totally optional.  Three students made movies.  I have put them all (and the movie I made) here.  Enjoy!!

Zoe G, Ellie M, Trent A  (iMovie created by Zoe G)


My iMovie

iMovie by Ellie M.

Turning Words into Math – Graphic Organizer

I made this graphic organizer to help my students quickly (and visually) reference the math symbols that words often translate into.  I had them glue it onto the back cover of their notebooks for easy reference.  The words are not centered on the page so that the paper can be easily cut down to fit onto spiral bound notebook pages.  The PDF file is below.  Thanks!  🙂

Words Into Math Graphic Organizer and Word Bank

Creative Commons License
I Speak Math Materials by Julie Reulbach is licensed under a Creative Commons Attribution-NonCommercial 3.0 Unported License.
Based on a work at https://ispeakmath.wordpress.com.