
What a difference a year makes! My current students saw all of the Barbie Bungee action from the sidelines as 6th graders last year. They have been asking me ALL YEAR LONG when we were going to do Barbie Bungee. This build up was terrific! Once they knew Barbie Bungee had arrived, they were begging for math class.
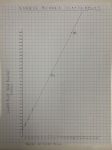
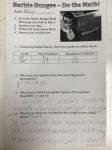
After all of the build up, my students took Barbie Bungee very seriously this year. I make it a competition, and they all wanted to WIN. They did multiple test drops, they measured carefully, and they drew beautiful graphs. I did not teach them about the line of best fit, but had them read about it here instead. I told them whoever had the most accurate data and the best line would win the competition! They were inspired to learn all about the line of best fit!
Again, I let them adjust their graph after the 90″ test jumps. This year I was tougher on them, and would not let them test jump again until they fixed their graphs.
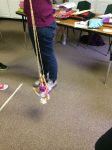
The big jump day was so exciting! Students were yelling and screaming. One group had a rubber band disagreement. They calculated the number of rubber bands and wanted to put a half of a rubber band on so their estimate would be perfect. They wanted to win. However, we don’t do half rubber bands, so the great rubber band debate ensued. They only agreed to put the last rubber band on seconds before the jump. It was a deadly mistake, and their Barbie was the only one to crash. It was a tragic (read great) learning lesson!
Please enjoy the pictures and the video. I have so much fun with this project and making the video each year. It is the best project I have ever done with my students!
My Procedure:
- Day 1
- Show students Bungee Jump videos on YouTube.
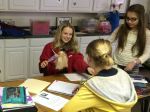
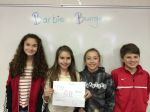
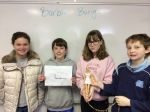
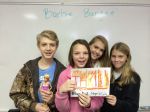
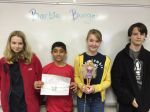
- Group students and have them come up with a company name, slogan, goals, and logo for their Barbie Bungee company. Have them read about the line of best fit for homework.
- Day 2
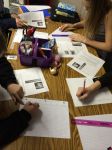
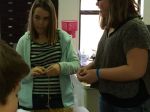
Give students the handout and let them do the test jumps and the graph. - Day 3
- TEST DROP day from 90″. Students adjust their graphs if needed, and get to add a data point to their graph and adjust their line of best fit if needed.
- Re-drop if needed once graph is completed.
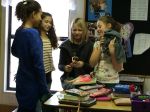
- Estimate how many rubber bands they will need to drop from 160″ and then attach those rubber bands to Barbie.
- Day 4
- JUMP DAY – Finish putting rubber bands on Barbie and then JUMP!
- Go to Alcula, enter their points, and see the linear regression equation, as well as how many rubber bands they SHOULD have used. Screaming ensues on this day as well.
- Day 5
Talk about the equation of a line. Have them speculate what slope means, what the y-intercept means. Blow their minds! 🙂

-
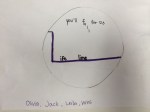
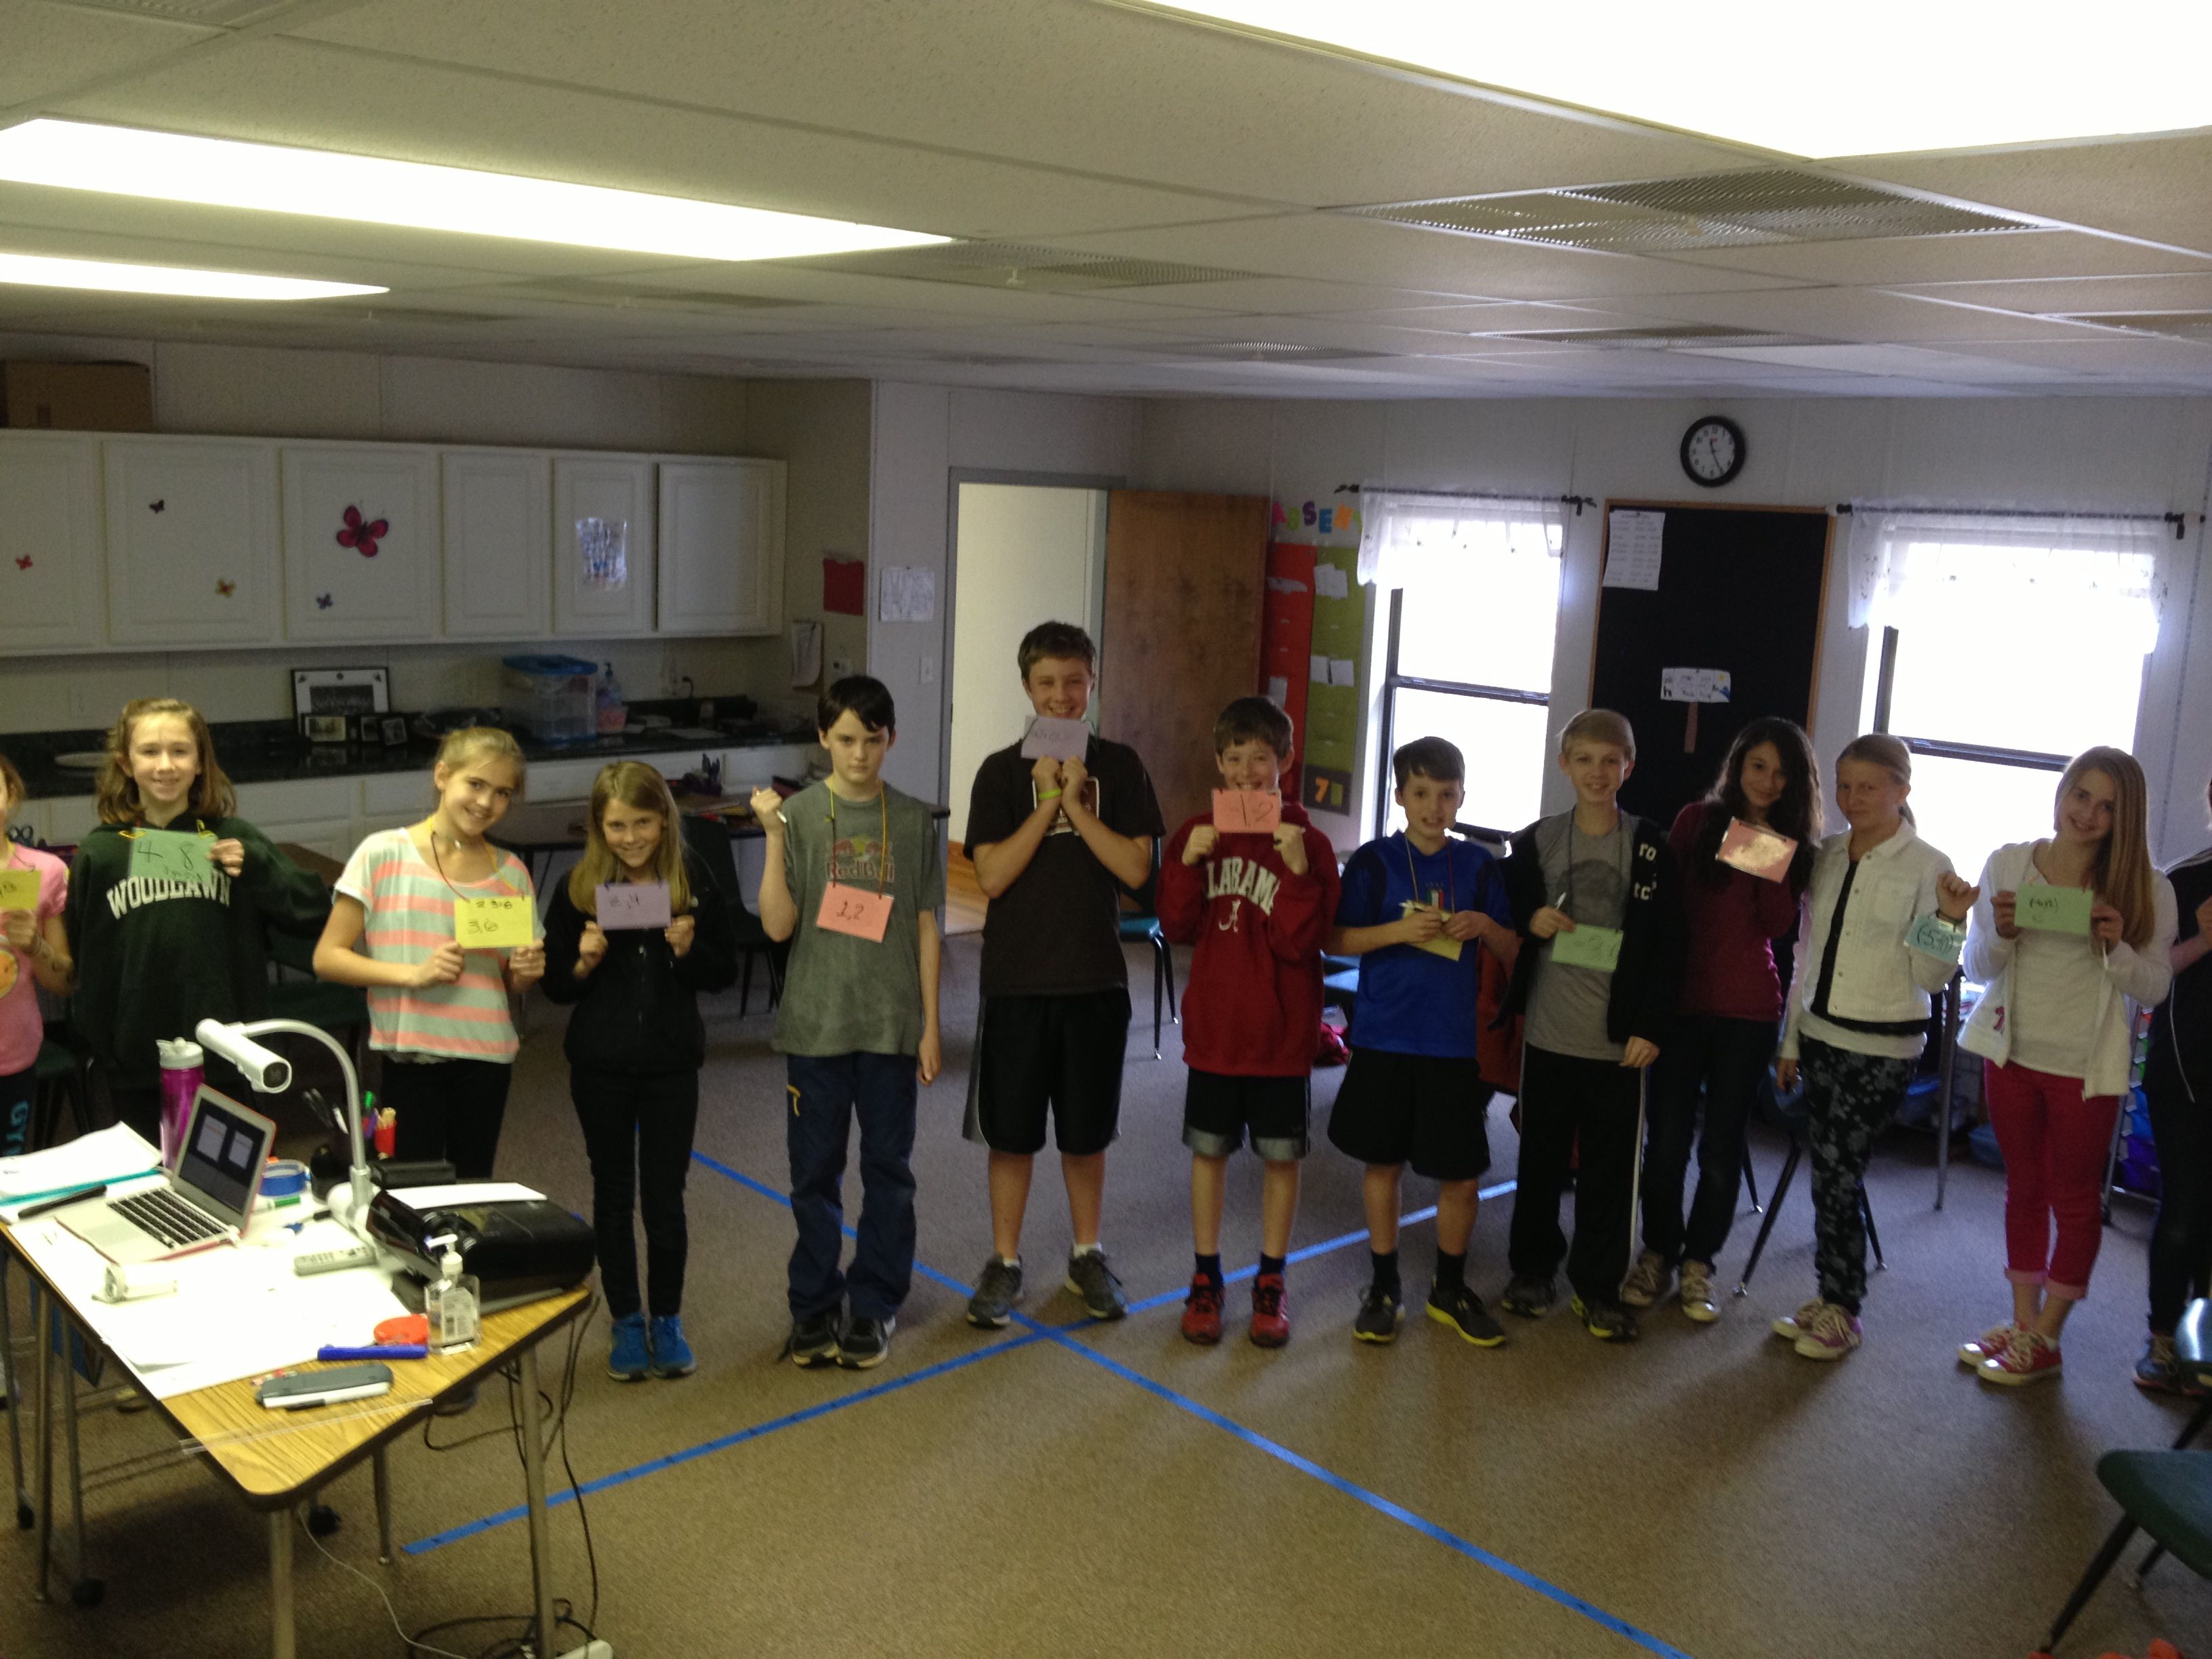
- Test Drop Day
-
- Plotting Data
-
- Plotting Data
-
- Analyzing Data
-
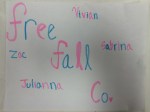
- Free Fall
-
- Free Falling
-
- Life Line
-
- Life Line
-
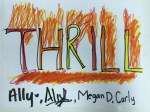
- Thrill
-
- Thrill
-
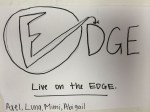
- Edge
-
- Edge
-
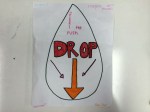
- Drop
-
- Drop
-
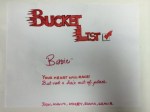
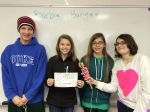
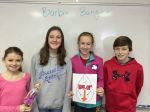
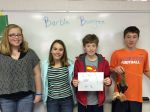
- Bucket List Barbie
-
- Bucket List Barbie
-
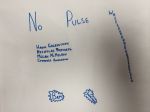
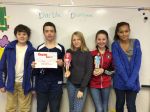
- Pulse
-
- Pulse
-
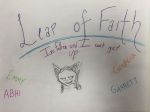
- Leap of Faith
-
- Preparing Barbie
-

- Preparing Barbie
-
- Preparing Barbie
-
- Post Analysis


