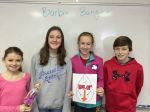
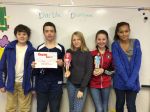
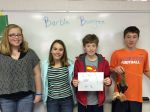
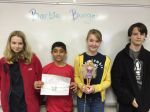
What a difference a year makes! My current students saw all of the Barbie Bungee action from the sidelines as 6th graders last year. They have been asking me ALL YEAR LONG when we were going to do Barbie Bungee. This build up was terrific! Once they knew Barbie Bungee had arrived, they were begging for math class.
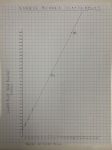
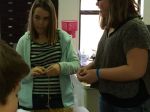
After all of the build up, my students took Barbie Bungee very seriously this year. I make it a competition, and they all wanted to WIN. They did multiple test drops, they measured carefully, and they drew beautiful graphs. I did not teach them about the line of best fit, but had them read about it here instead. I told them whoever had the most accurate data and the best line would win the competition! They were inspired to learn all about the line of best fit!
Again, I let them adjust their graph after the 90″ test jumps. This year I was tougher on them, and would not let them test jump again until they fixed their graphs.
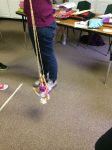
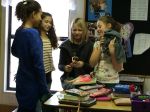
The big jump day was so exciting! Students were yelling and screaming. One group had a rubber band disagreement. They calculated the number of rubber bands and wanted to put a half of a rubber band on so their estimate would be perfect. They wanted to win. However, we don’t do half rubber bands, so the great rubber band debate ensued. They only agreed to put the last rubber band on seconds before the jump. It was a deadly mistake, and their Barbie was the only one to crash. It was a tragic (read great) learning lesson!
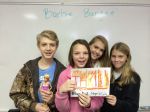
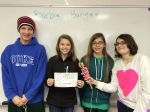
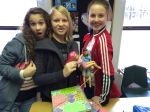
Please enjoy the pictures and the video. I have so much fun with this project and making the video each year. It is the best project I have ever done with my students!
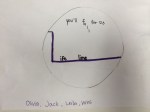
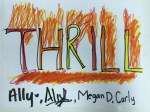
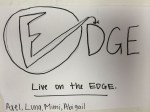
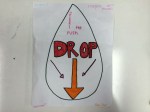
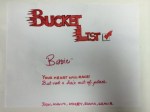
Group students and have them come up with a company name, slogan, goals, and logo for their Barbie Bungee company. Have them read about the line of best fit for homework.
Day 2
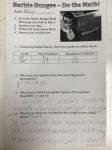
Give students the handout and let them do the test jumps and the graph.
Day 3
TEST DROP day from 90″. Students adjust their graphs if needed, and get to add a data point to their graph and adjust their line of best fit if needed.
Re-drop if needed once graph is completed.
Estimate how many rubber bands they will need to drop from 160″ and then attach those rubber bands to Barbie.
Day 4
JUMP DAY – Finish putting rubber bands on Barbie and then JUMP!
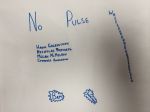
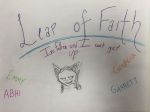
Every now and then I have my students watch an explanation (teaching) video online. I sometimes do this as a review when I’m beginning a topic that they have studied before. They always hate it. They always complain. So, I rarely assign them teaching videos to watch. They really hated the last one I assigned. Their complaining gave me the idea to have THEM make their own teaching videos – and to do it better!
The Video Tutorial Project took a week of class time (and that included watching everyone’s videos one day in class). However, I did not give them a review day or a test for this unit, so it was only about 3 extra days. In their written reflections, it was clear that my students LOVED this project. And, their videos were impressive. They were creative in their presentations and even added transitions, music, and even special effects. My favorite video was a take off of Vi Hart’s videos. There is no way I could have made a video this good, ever!
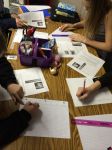
I partnered the students into groups of 2, and let them pick their topic from our current unit. They had to state and define their topic, then show three clearly worked out examples, increasing in level of difficulty with each example. They could make the video anyway they wanted. They all had to upload their video to YouTube.
I created a project planning Google document for them to follow, and distributed it using Doctopus. I had them create the three examples problems for homework one evening and submit them on a GDoc form. That way, I could check to make sure their examples were sufficient. In class the next day, they made any necessary corrections and planned their video. They had the next three days to record and edit their video (if they chose to edit it). I gave no other homework this week so that students would have time to work at home on it if needed.
This project was worth the time invested and I will definitely do it again. The students loved it (see their responses below). We had a few challenges that I would like to address before assigning this again. One was finding quiet places to record on campus (it was freezing that week so it was not very comfortable outside). Another challenge was the partner issue. Students could only work together at school because this was a partner project. Also, the video editing (if they use iMovie) always falls on the shoulders of one of the partners, which I don’t like. I have thought about having each student make their own video tutorial, but they have so much more fun working together. Also, in their reflections all of my students but TWO would rather work with a partner. They also would have liked more time, but they always tell me that. They would work on a project for a month if I let them. They are awesome.
Student Thoughts: What did you like the BEST about the project?
I felt like it really helped me even because watching the video helped understand the concept better.
How we could add our own interesting twist.
The part about how you could add in a challenge problem.
I loved how you can create a tutorial in so many ways, like white board or like V Hart.
working with a partner how creative we got to be
THE FREEDOM
it was fun
All of it!!!
having fun with my friend
Recording 😀
The fact that we could put what we wanted into the video
Getting to use my tablet to draw math.
We had alot of freedom to make it however we wanted and everyone had a different video.
I thought it was very creative.
filming
working with partner
that we got to make a video
Working on whiteboards and working
partner work
Probably putting it all together
That is wasn’t just an ordinary project.
The filming part.
the creative freedom was fun
the filming
The recording
It was awesome to just be able to go out on our own and make our own tutorial.
After my post about Electronic Student Portfolios, I had many great questions in the comments asking for more details about how to start a wiki, or how I implement wiki’s in my classroom. Wiki’s are great for classrooms because you can control who can edit, comment, and even view the pages. You can make your classroom a private wiki that is only viewable by people that you invite. My student’s pages are publicly viewable, but only members of my wiki can leave comments on the pages.
To get started, you must first create your own wiki for your classroom. I use pbworks for education. I use the basic version, which is FREE! They do have an option with additional features that costs $99 for a year. But the free version has been enough for my classroom for the past four years, so it’s a great place to start. Click here to sign up for your free classroom wiki from pbworks.
You will need to add each student in order for them to create their own page or even comment on the pages. They will use their email address and create a password. I wait to do this until I am ready for them to create their pages and they have all read my wiki guidelines, which I got from the amazing David Cox. He’s way ahead of me with all things technology, so I just took a page from his book (thanks again David!). To add your students to your class wiki you can invite them using their email or have them requests access. Once added, they must be logged in with their email and password to edit or comment on the wiki. They will lose this password, so I have them write the information on the cover of their math notebooks.
Creating their own wiki page is very fun for them to do, and I count it as a project grade. I created instructions for my students to create their own wiki pages. The instructions I give my students are step by step and I expect them to read and follow the directions carefully. This can be challenging for middle school students at times. To help them find the answers to their many questions when they are creating their wiki pages, I created a Google Drive Question Documents.
Instead of raising their hand and not working while they wait for me to get around to them, I have them type their question into this Question Document, under the step number that they have the question on. This is important because this makes them read the question again. I reply by typing onto the document. Almost all of their questions are answered in the instructions so I usually instruct them to go back and carefully re-read the directions.
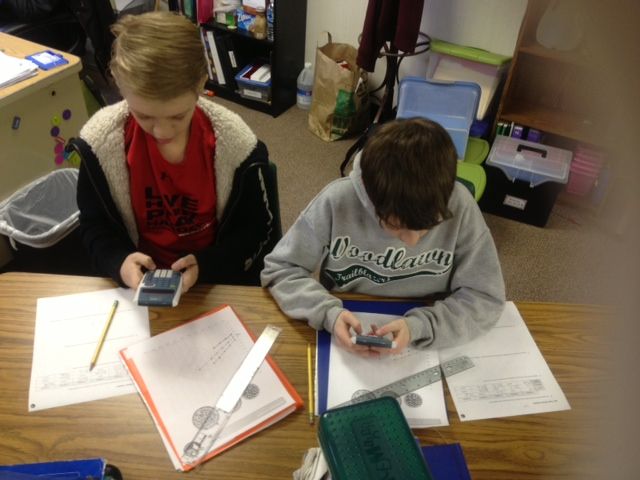
This lesson is intended for students in Algebra 1. However I did this lesson with 6th grade students who had not learned linear equations yet. After introducing the lesson, I gave them the student handouts. The student handout was self-explanatory and easy for my 6th grade students to follow. I gave each student their own set of handouts but let them work in pairs so they had someone to talk through their work with.
I appreciated that there were several related questions. This made students aware that they had made a mistake in a previous question so they knew they had to go back and rethink it.
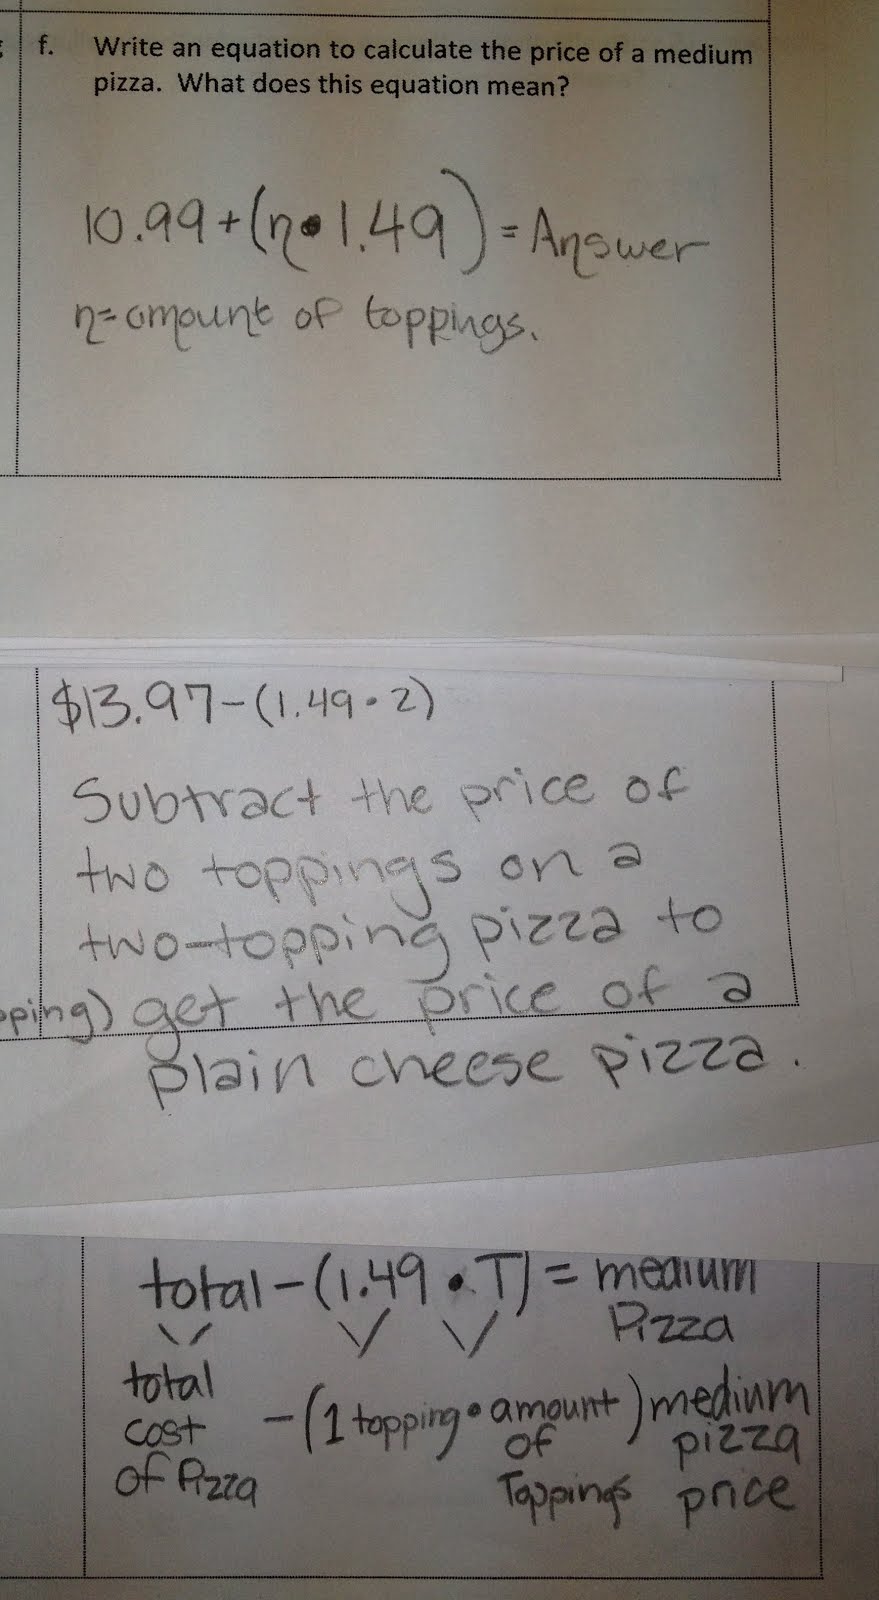
The questions were leading enough so that my students (who had not written linear equations yet) were able to summarize their findings. I was pleasantly surprised that several students even came up with an equation.
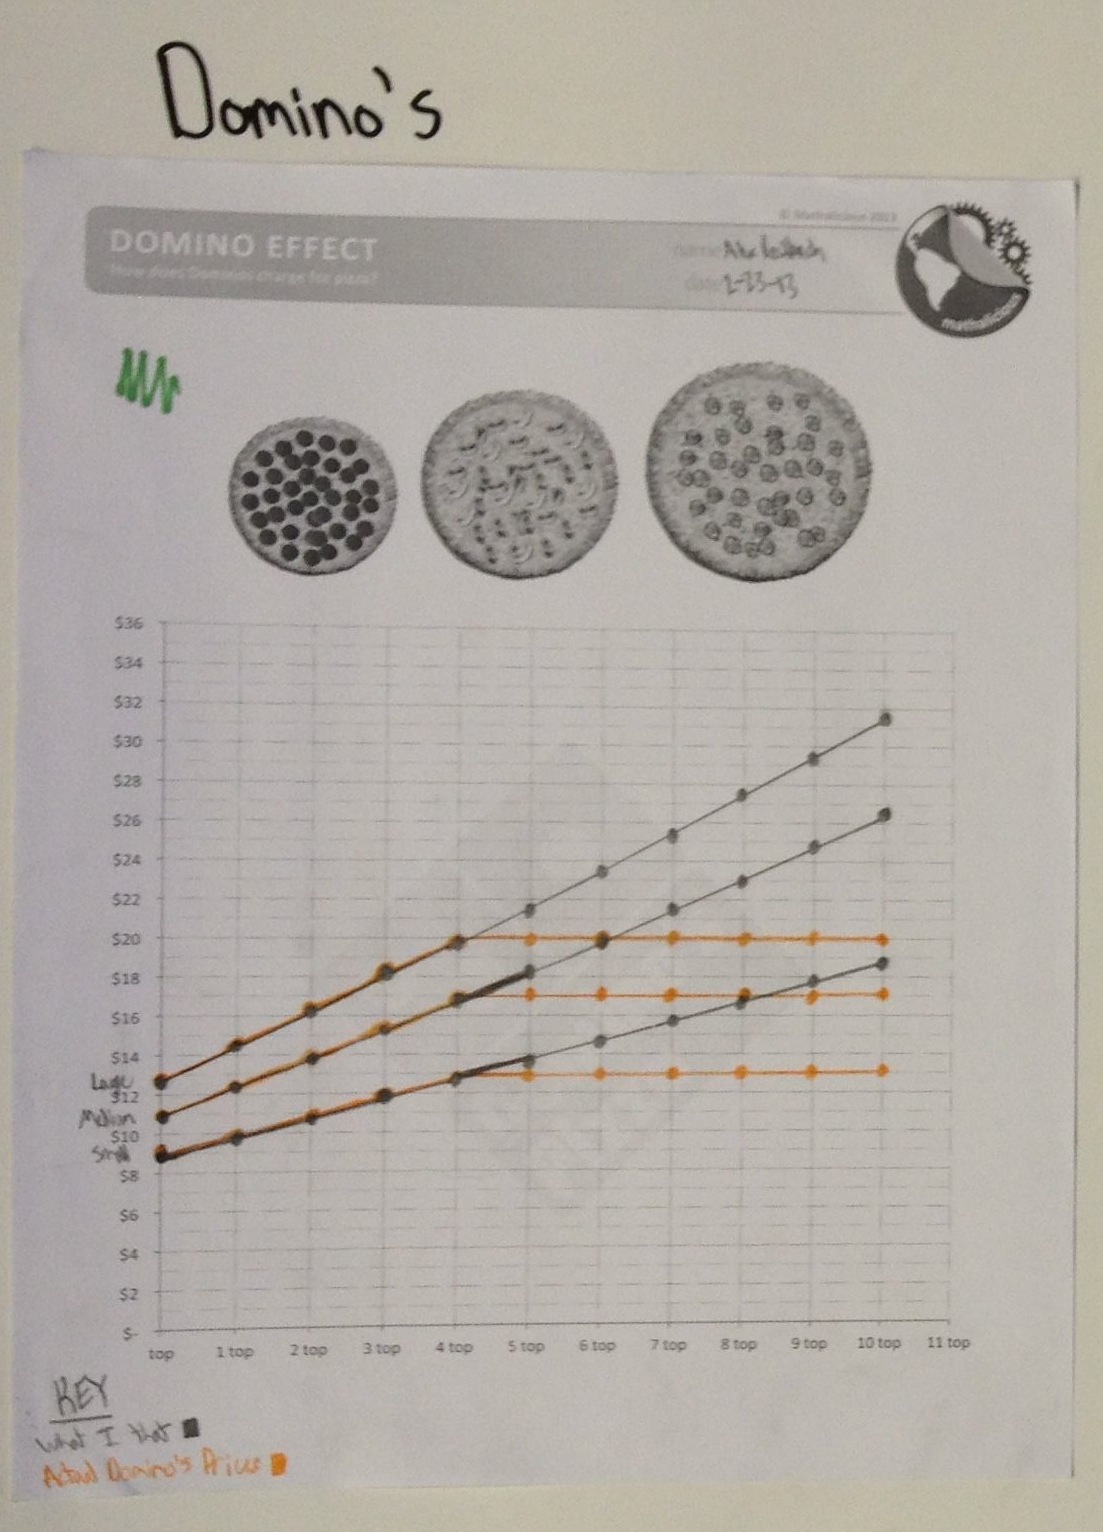
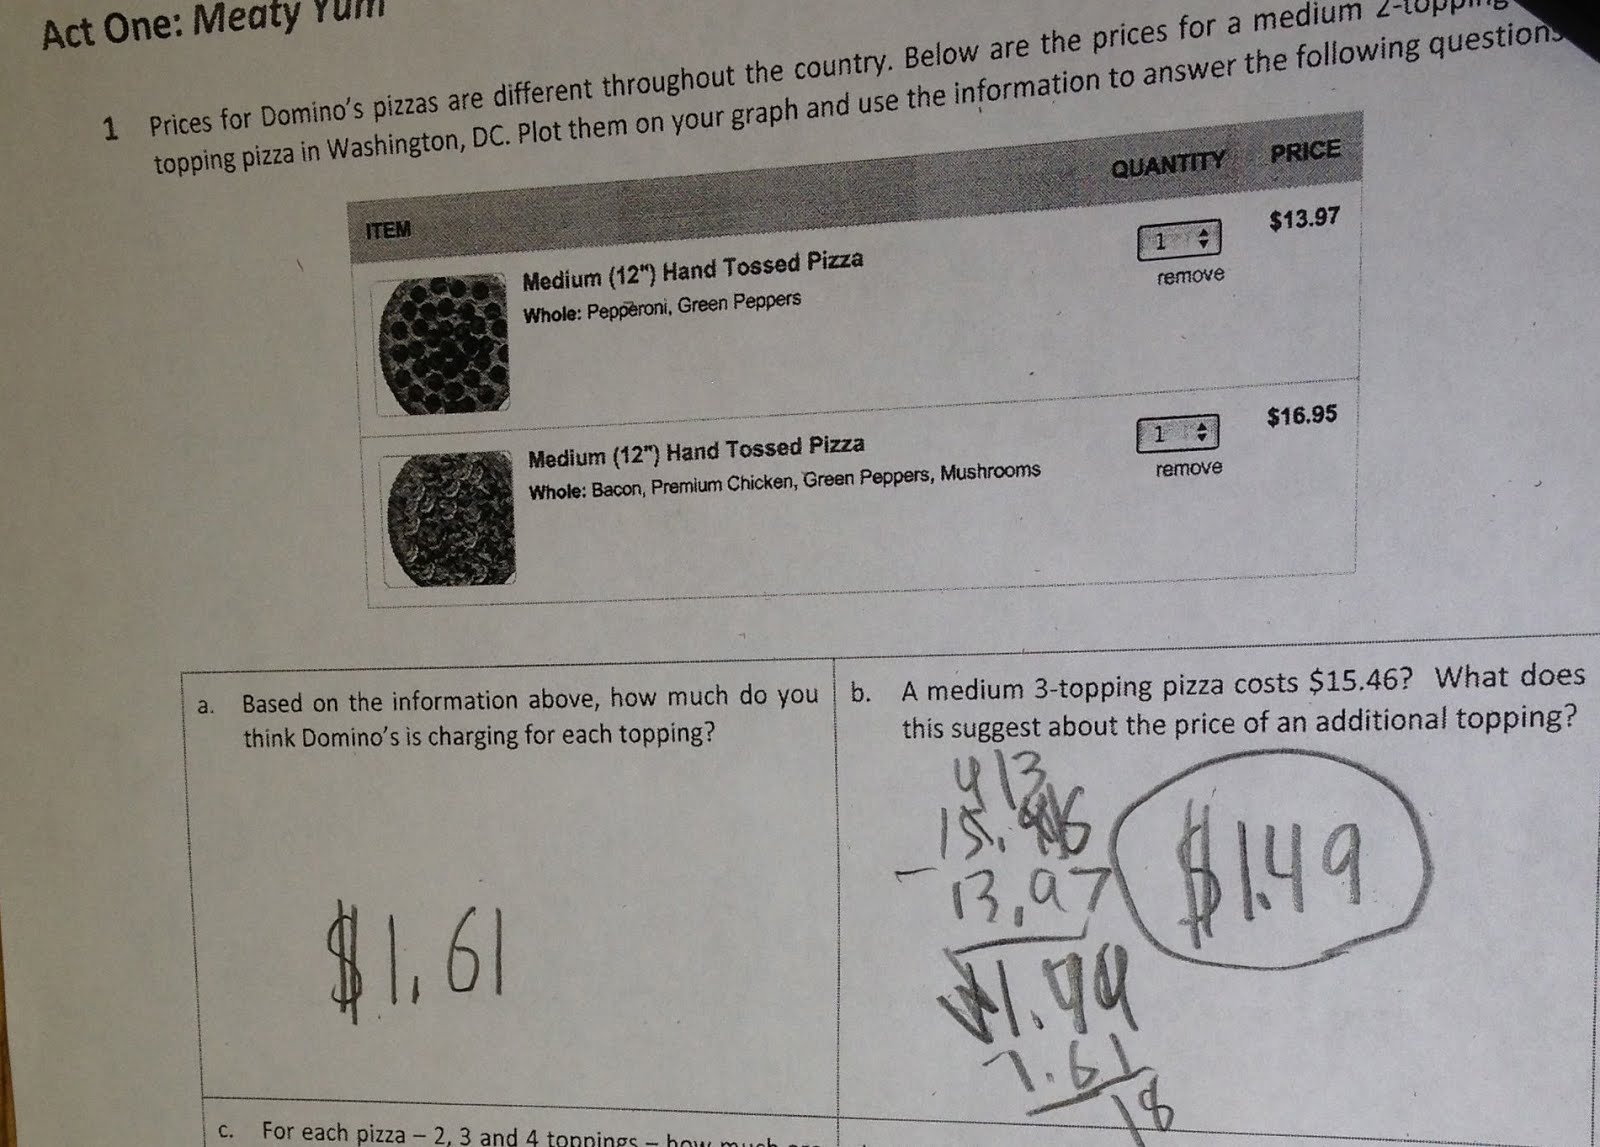
Many students ran into trouble in Act 2 on question number 2, when they assumed that the medium topping price was the price of toppings for all pizza sizes. The layout of the chart alerted most of these students that they had made a mistake when they noticed that a 2-topping small pizza was $10.48, but a 3-topping small was only $10.99. Other students discovered this when graphing the points. I noticed that some students did not notice this discrepancy at all, but and let them continue to fill out the chart incorrectly. To help students discover their mistake, I asked them if they could figure out how much a small, medium, and large 10-topping pizza would be.
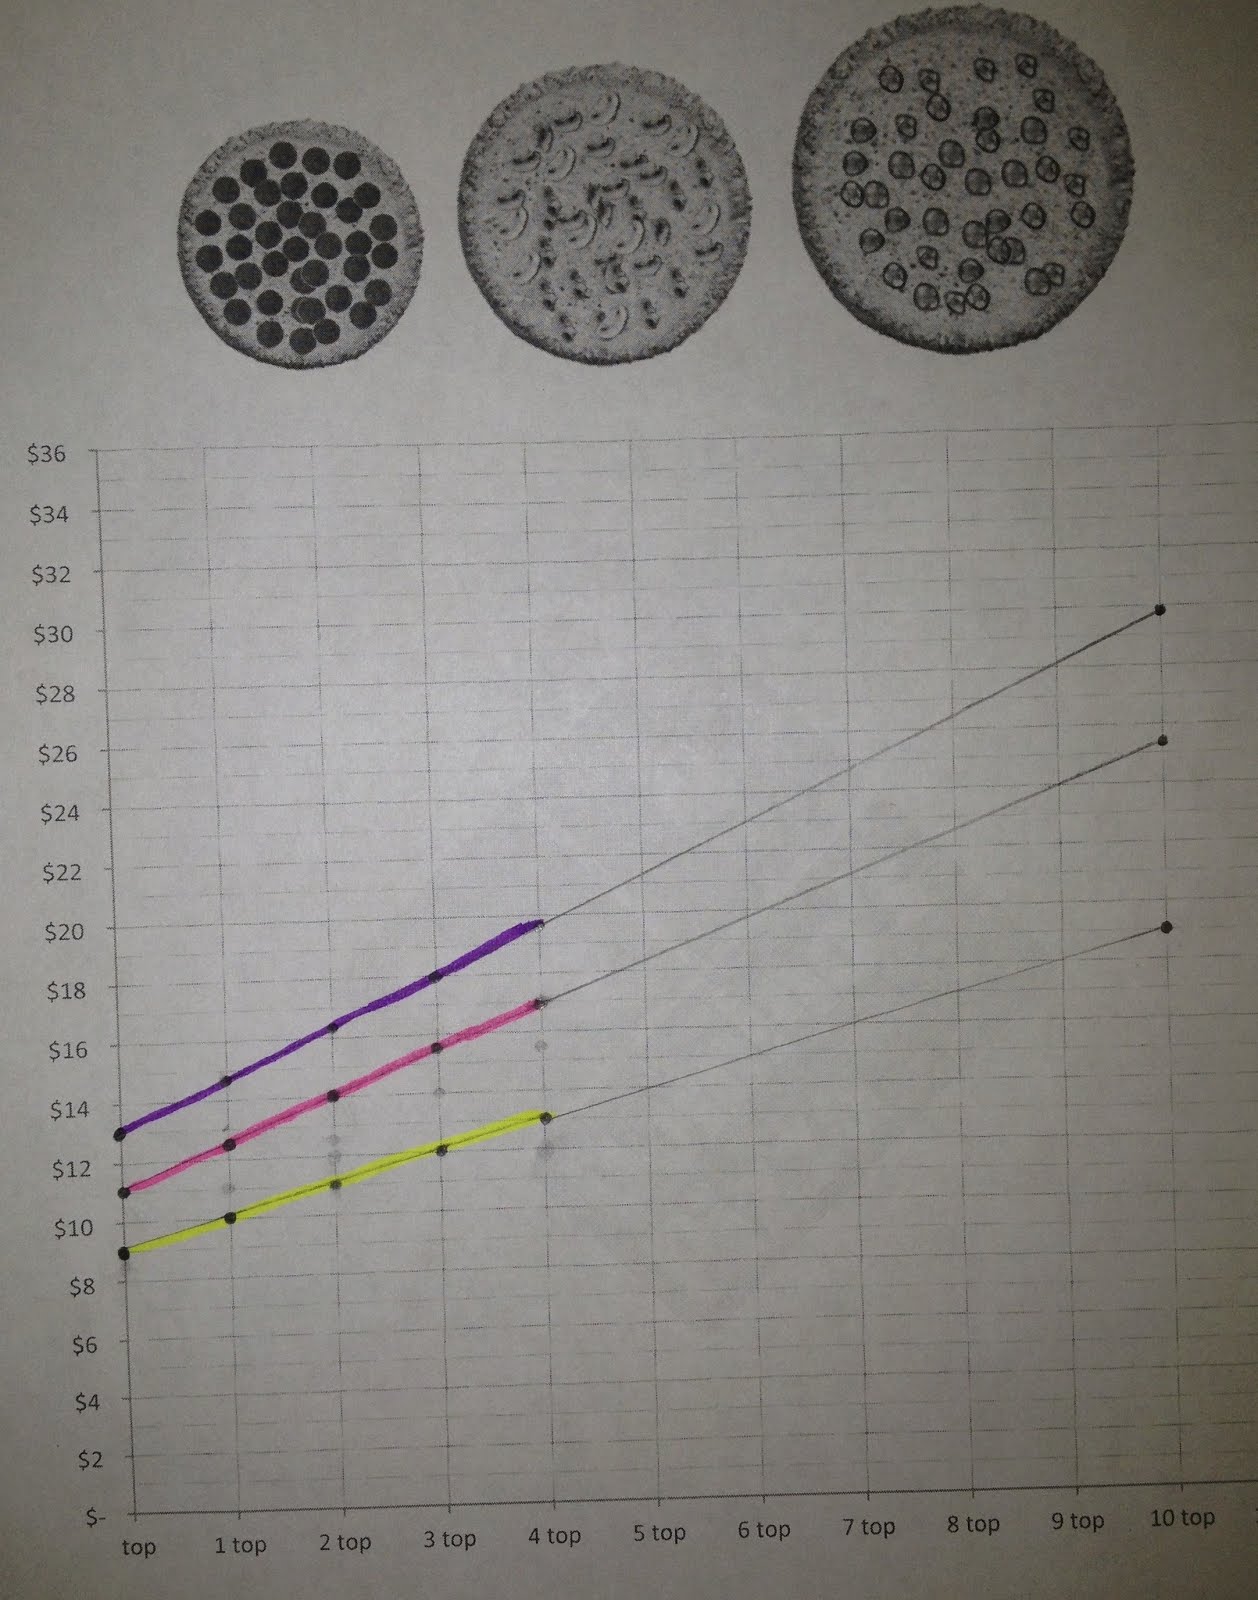
Some students went straight to their calculators. Other students wanted to use their graphs but were not sure that they were allowed to extend the lines. This was another opportunity for discussing lines and patterns. They loved this “shortcut” and that it quickly helped them price their 10 topping pizzas.
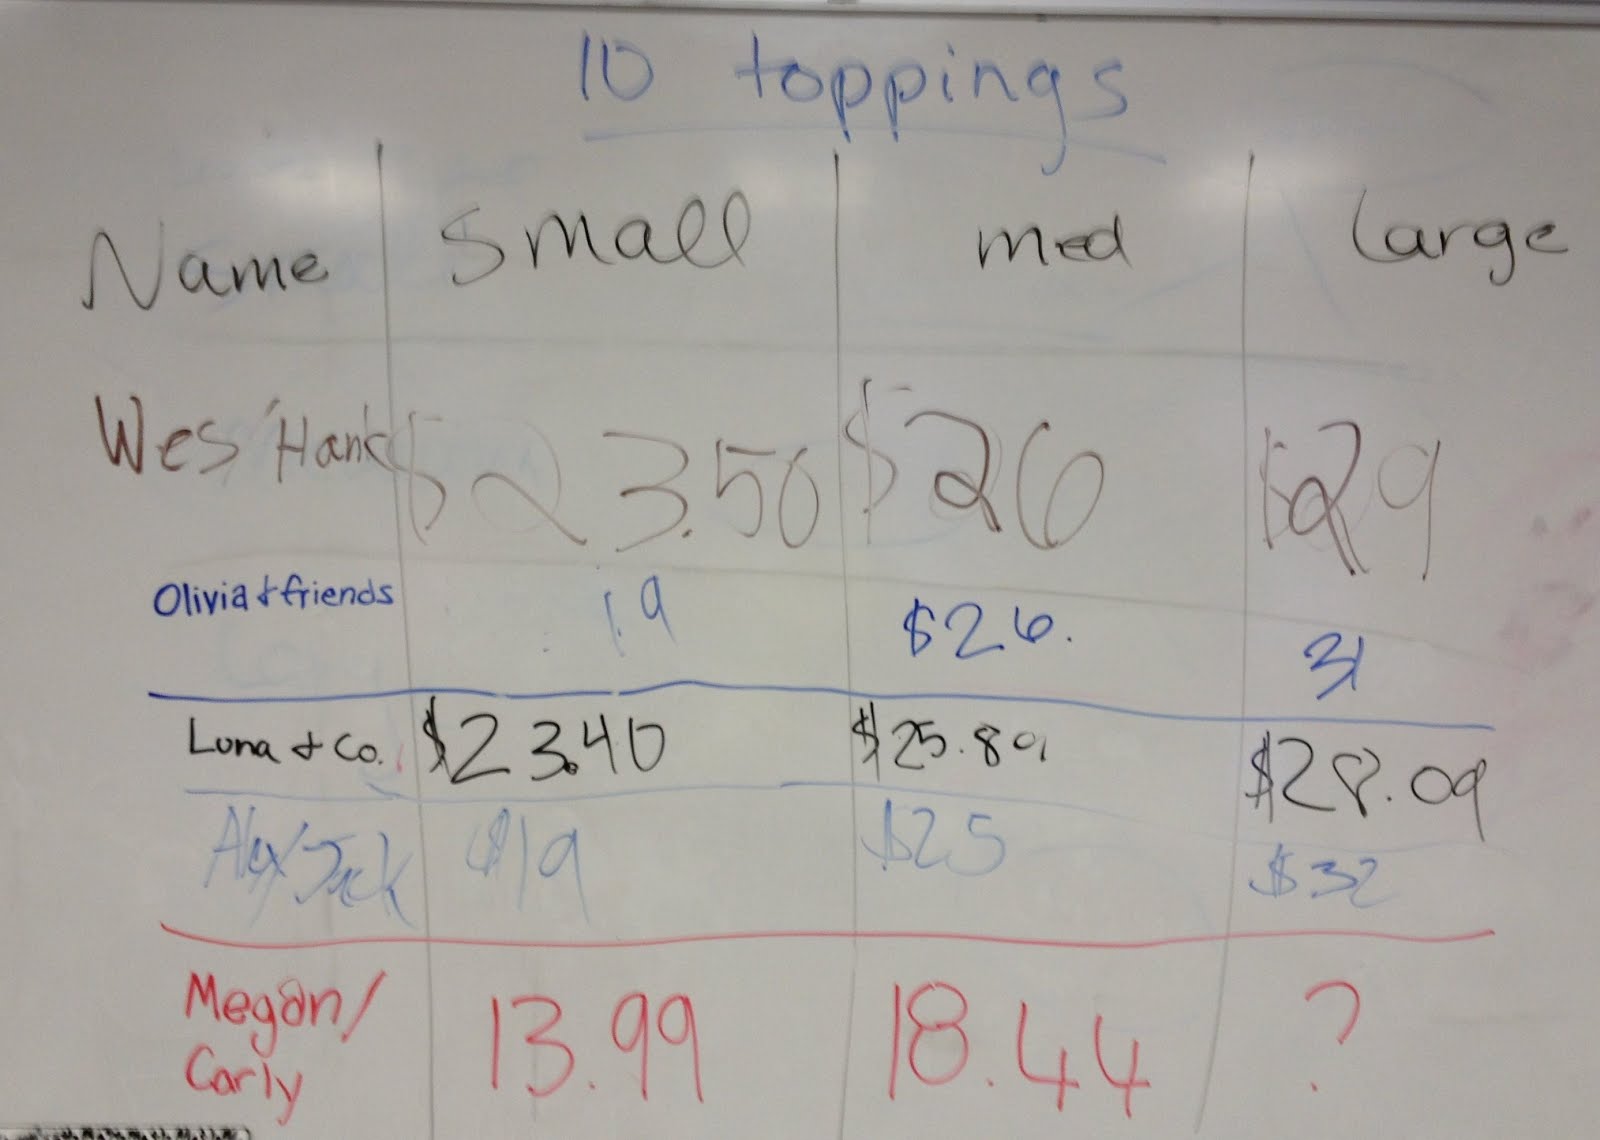
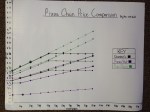
After all of the groups had come up with their 10-topping pizza prices, I drew a large chart on the board and had the groups fill in their prices to illuminate the differences.
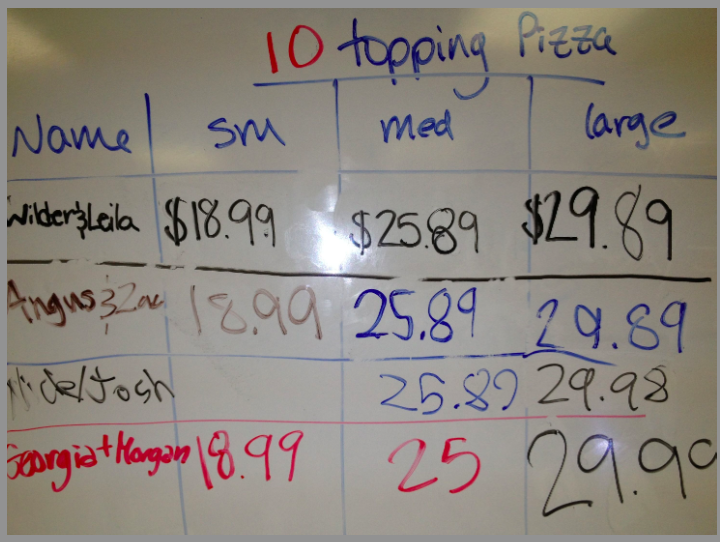
Once they saw that other students pizza pricings were different, they had a heated class discussion about who was right. “Proving” their calculations to each other helped all of the groups realize that the topping price was supposed to be different for differently sized pizzas. After everyone had time to find and fix their mistakes, they updated the board chart to make sure everyone was now on the same page.
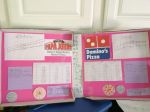
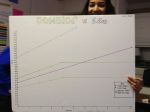
I liked having them find the price of a 10-topping pizza because it prepared them for the big reveal. My students pretty much lost it when they saw Domino’s actual pricing, since it was so much less than they had calculated. They all wanted to fix their graphs, which of course, I was thrilled about, so I let them. Notice the key at the bottom on the picture. (That is supposed to be thought).
I loved this lesson because it was fun, self-explanatory, and easy to implement. It was written so that I was able to walk around the room and support students that needed extra assistance or were going down the wrong path. I did not “teach a lesson”, but at the end of Act 1 several of my students had figured out the equation by going through the questions.
This can be done with younger students, even if you haven’t taught linear equations yet. In fact, this is a great introduction to the topic of linear equations. Next time I do this lesson with 6th grade students, I will do this over two days. The first day I will do Act 1, and then finish with the chart on Act 2. Then, on the second day I will explore Act 2, questions 3 and 4 in more depth. Only a few students were able to come up with the equation in Act 1, so I will need more in class time to help them discover this in Act 2. I anticipate that I can teach students about writing equations of lines and even explore what the y-intercept really means with this lesson.
My students are diligently working on a pizza project from Mathalicious. They are trying to drum up survey results, so I thought I would help them out. Please fill out these two short ONE QUESTION surveys if you have a moment.
Just to clarify, they need the toppings for a SINGLE pizza. Thanks Katie! 🙂
Yes, it’s Monday. Wednesday night I attempted to upgrade the software on my computer to Mountain Lion. After a few hours, all I had on my Mac was a white screen with an apple and a spinning disk (and spinning, and spinning). After five calls to Apple care over the next few days, my computer would not load. Word to the wise, Mountain Lion install is buggy, period. Contrary to what the Apple representative told me on the phone, I was NOT the only person to have an unsuccessful upgrade. On Sunday (the only day I could get an appointment) the Apple store was FULL of people who, like me, had unsuccessfully tried to update to the new Mountain Lion OSX. WHY does Apple lie to us? It’s not like we aren’t going to find out the truth when we are sitting with tens of people with the same problem at the Apple Store. And, why couldn’t they help me over the phone instead of sending me to the store? At the store, I wasted more of my time having a technician “fix” my computer. The fix? They had to wipe my entire computer. I could have done this myself, from home, and saved so much time. Thank goodness for Dropbox as I didn’t lose any files. However, it is such a pain to reload all of your programs, email, and account settings. Thanks Apple, LOVE the upgrades! 😦
Back to this week! It’s time for projects and project based learning! Sorry for the delay! Please enjoy the links below.
I just spent five of the most amazing days of my life at “Twitter Math Camp 2012” or #TMC12. I have been anxious to blog about it since I came home. However, I have also been simply overwhelmed with all that it was. I doubt that I can convey to any reader the enormity of this experience, or how much it has changed me and help me grow as a teacher. I feel like the best way for interested teachers to get a true sense of what #TMC12 really was about, is to read all of our posted experiences and quilt them together (links to other blogs at end).
When trying to explain this conference to my non-teaching friends, I tell them. “Think about the best teachers that you ever had. Put them all in one room. Ask them to all tell you their best ideas and strategies. Listen in awe. Take tons of notes. Learn from the best.” This was a meeting of the most creative, innovative, and inspired educators that I have ever been privileged enough to know. Everything said this week was important, and relevant, and will directly help me with my students this year. In fact, I will be lucky if I can even try out a fourth of the things that I leaned about at Twitter Math Camp. These teachers are doing amazing things in the classroom.
How was I lucky enough to be part of this? I am an impassioned educator who loves to talk about teaching math, all the time. Just ask my family, I drive them crazy. Thankfully, I found a bevy of great folks on Twitter to talk about teaching math, 24/7. Since I found them a couple of years ago, we have talked practically non-stop about teaching math, planned lessons together, given each other great ideas, participated in book studies, and generally just supported each other through the thick and thin of teaching. I love to talk to them because they love to teach as much, if not more, than I do. They are always working, planning, wondering, and thinking up new ideas for their students and their classrooms. They are all brilliant, and fun to talk to as well! So much fun in fact, that we all started talking about getting together, to meet, in real life. It started out almost like a joke, and I pushed hard for a cruise. I even made a wiki page for the cruise! But, time passed and we went back to our crazy, hectic, teacher lives. At least until two amazing teachers, Lisa and Shelli, actually decided to do something about it. Thus, #TMC12 was born.
I have been to multiple conferences in my many years of teaching. This was by far the best PD (professional development) that I have ever attended. What made #TMC12 so much different, so much better? The key was that this was a teacher’s conference, by us, for us. We knew what we needed. We cut straight to the point in our presentations. There was no wasted time. I appreciated that and really felt like these amazing teachers are my people. They understand me and knew what I needed. They don’t think I am weird for wanting to talk about teaching all the time. They can’t wait to discuss a great idea as well. And we never stopped talking about teaching. We talked about it over breakfast, all day long, at lunch, dinner, and even when we were hanging out at night. And we had so much fun at night! After a whole day of cramming our brains full or math and teaching ideas, we loved hanging out together even more at night. But we never tired of talking about teaching! We could be in the middle of a song, have an idea, and stop singing to talk about it immediately. One verse later, we would jump right back in to singing (or dancing) again. We even talked about education up until the very last minute, when we waited, together, for our departing flights in the airport. Education was our undercurrent.
I learned more in these 5 days that I have in a year of reading blogs. At the end of each session, poor Lisa had to cut us off. We were so excited about each presenters ideas that we would have talked for hours. My educational highlights for the week included:
Talking about how students learn, developing new lesson ideas, and learning new ways to present slope with the Math 1 folks.
Learning about many more uses for whiteboards. (Mistake camp).
Daily Favorite Things sessions (which will continue through the year via blogs – YEAH!)
Developing ideas for how video can be used to improve the classroom instead of just “flipping” it.
Collaborating post-session with multiple teachers about the best way to represent integer subtraction.
Many side conversations about homework
Giving ownership back to the students including numerous ways to get students talking about math and working together in math class.
Interactive Notebook Nirvana
Meeting people (not related to me), that had actually read my blog.
Discovering (in the airport) that even teachers I greatly admire wonder if they are good teachers. It made me feel so much better about my teaching and my failures.
Technology, technology, technology. I may never even have a chance to try all of the amazing new websites that I learned about! I wish I had taken better notes (thanks Rachel).
Math club collaboration
Marshmallow guns shoot much harder (and farther) than you think.
Having FUN in presentations with the presenters (even if it was off topic or off color sometimes)
Jinx Tweets! When people would think about the same thing, at the same time, and tweet it. It was unreal how much this happened. Our brains work alike.
My personal highlights:
Bonding with people immediately even though I was so nervous about going and talking to people I had never met IRL.
Finally meeting everyone that I had been tweeting for years with and discovering that they were all exactly like their tweets!
Just that feeling that you have when you are surrounded by people that totally get you, and still like you, for who you REALLY are.
Doing “The Squirm” with my math class song mentor, Sean. He even offered to write me a song for my class (love).
Finding several other teachers that wear their purse cross body, on the right side.
Making stupid jokes that people laughed at bc they have my same weird sense of humor.
Feeling comfortable being as loud as I wanted to be. (Thank you all for putting up with me).
Having an enormous group of people who also sing at random just because they hear two words that makes them think of a song. (Actually, having tons of people who would just sing with me, at random, whenever I started singing. I didn’t even have to ASK!)
Going around in a giant group – EVERYWHERE.
Square dancing on the sidewalk in the middle of lunch just because we thought of it.
Teaching a movie theater full of people to dance before a movie – and everyone did since my friends were all into it.
A whole world of people that are as obsessed with office supply stores as I am!
Dressing up like Sam
Getting less sleep than I did in college because I never wanted to stop talking to these amazing people about math and teaching!
Generally just being around people that are CRAZY fun, more crazy fun than I ever thought people could be.
TWEET ME MAYBE! (thanks for the extra credit Sean)
My only regret was that even though I stretched every day to the limit, I did not have enough time to talk in depth with all of the people that I wanted to talk to. Everywhere I looked fascinating conversations were happening all around me. It was almost impossible not to get completely immersed and remember to move around. I’ll definitely be coming back to #TMC13 to pick up where I left off.
I felt like I was with people that “got me”. And I loved that many of the Twitter Math Campers even thought the way that I did. In fact, if I said (rather sang) this blog post title out loud (TMC – People Just LIke Me!), I now know a few people, IN REAL LIFE, who would sing, “You’re down with OPP, Ya you know me!” in their heads, if not OUT LOUD, with me. They are smart, fun, quirky, real, and down to earth people who truly care about other people and are willing to sacrifice fame and fortune to change the world. They care about education, they are serious about their jobs, and they love their students. They are an amazing group of math teachers.
If you are a math teacher out there who wants MORE, then I implore you to explore Twitter and start reading blogs. We will help (Twitter/Blog newbie website coming soon)! In fact, if you don’t tweet, you should definitely read the words to this song that Sean, Rachel, Sam, Dave, and Bowman wrote at #TMC12. It should resonate with you. We want to help you! So, “Tweet Me Maybe” at @jreulbach!
Tweet Me Maybe
by Rachel Kernodle, Sean Sweeney, Sam Shah, David Peterson and Bowman Dickson
I sat alone in my class,
Hoping my students would pass,
Prepping was kicking my ass
But help was on the way
I started searching the net,
To find a way to connect
Found teachers I’d never met
and I was on my way
Dan’s blog was poppin’,
G-Reader, feed not stoppin’
Each day, I would drop-in
Guess it’s time for hop in!
Hey, I just found you, And this is crazy,
But here’s my ID, So tweet me, maybe?
It’s hard to reach out, Please don’t flame me,
But here’s my ID, So tweet me, maybe?
Hey, I just found you, And this is crazy
But here’s my ID, So tweet me, maybe?
It’s hard to reach out, Please don’t flame me,
But here’s my ID, So tweet me, maybe?
Oh holy crap can it be,
Nowak responded to me,
Blogging math celebrity,
She’s twitter royalty
I beg, and borrow and steal
No reinventing the wheel,
What are these urges I feel?
Nerdy math sex appeal
Hal-lo-ween was awesome
Dull worksheets, I could toss ‘em
My, i-deas could blossom
Now it’s time for Math Camp, baby!
Hey, I just met you, all in person.
Twitter Math Camp, this was the first one
It’s hard to teach right, in i-so-laaaaaation,
So here’s some PD, just like va-ca-tion
Hey, I just met you, all in person.
Twitter Math Camp, this was the first one
It’s hard to teach right, in i-so-laaaaaaation,
So here’s some PD, just like va-ca-tion
Before I came onto your sites,
I must’ve taught so bad,
I must’ve taught so bad,
I must’ve taught so so bad
Before I came onto your sites
I must’ve taught so bad
and you should know that
It was so, so sad
I loved free pizza, and the brew-ry.
You know my ID, So tweet me, maybe?
Ci-ty Muse-um, or the Card’s game,
So tweet me sometime, I won’t be too lame
So, thank you Shelli, thank you Li-sa.
Don’t want to go home – so glad to meet ya
Now that it’s coming to an end
we’ll miss you so bad
we’ll miss you so bad
we’ll miss you so, so bad
Before you came into our lives
We must’ve taught so bad
And you should know that.
So tweet me, maybe?
Other Blog Posts About TMC12 – These are the blogs that have been written as of today. If you have written a blog about TMC12, please put the link in the comments so I won’t miss you!
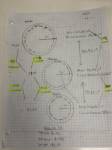
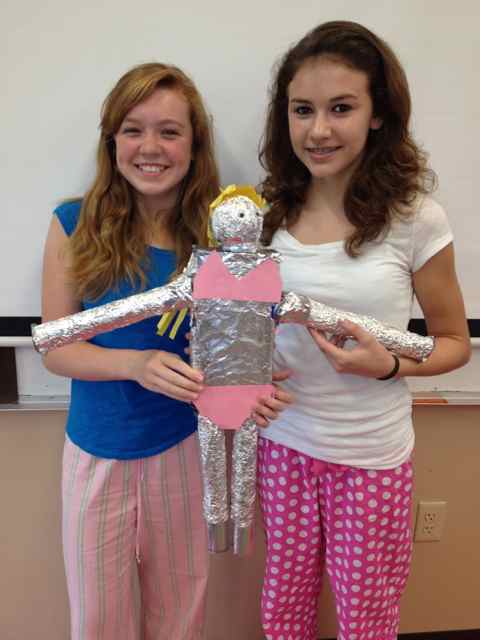
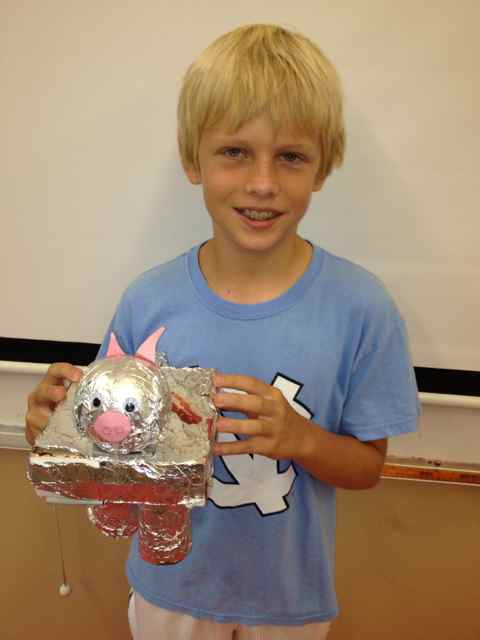
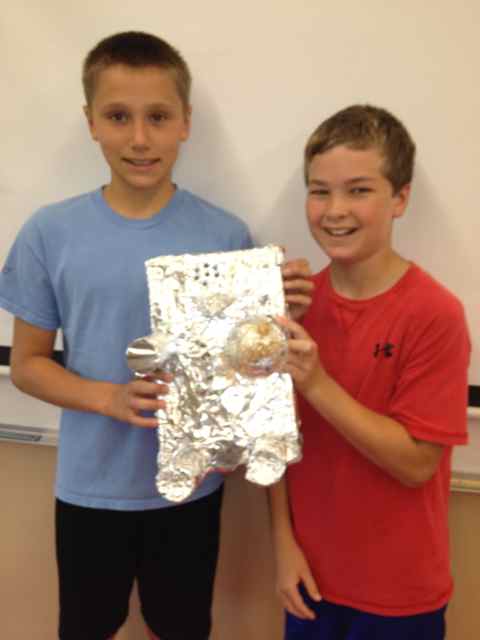
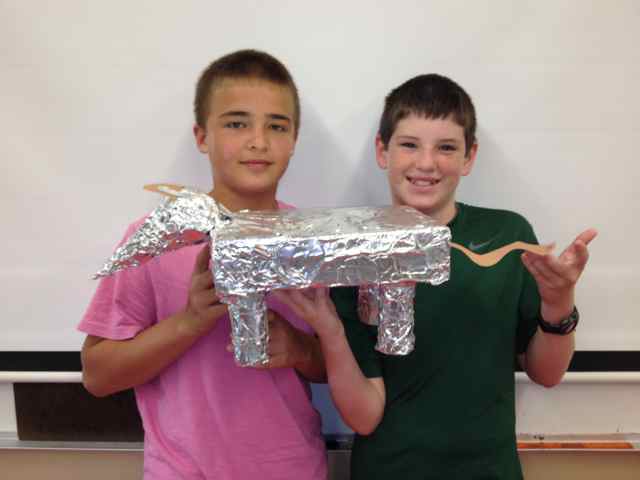
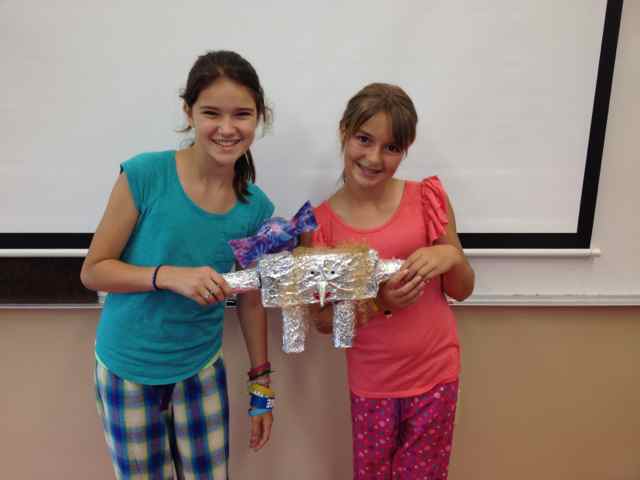
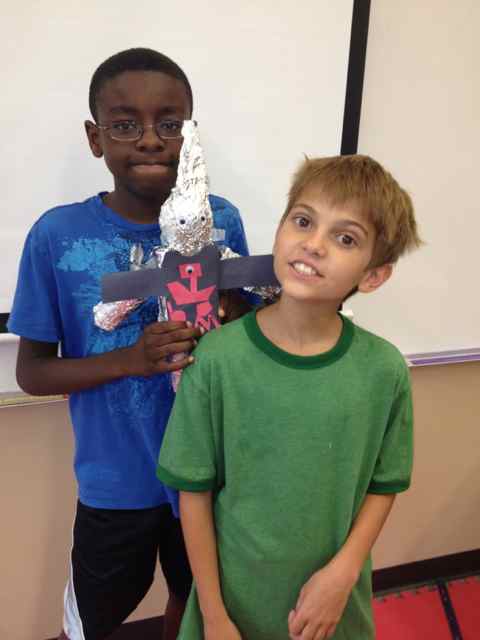
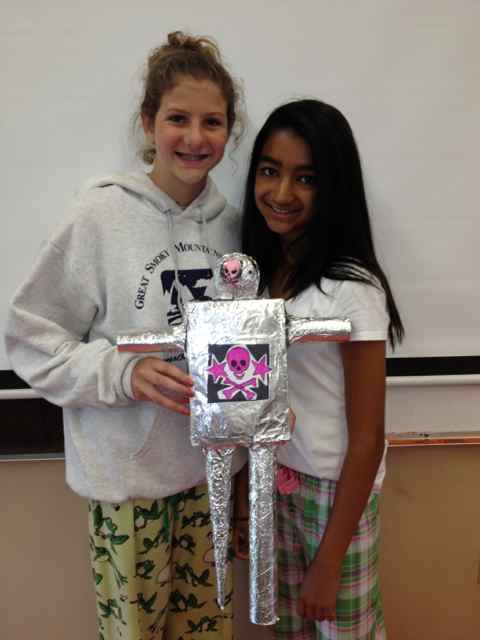
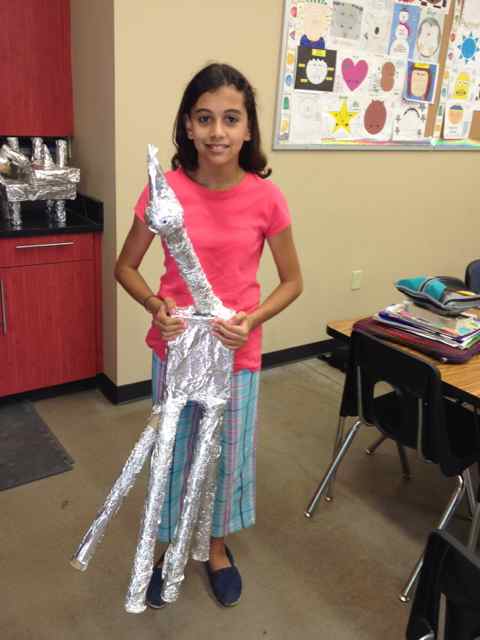
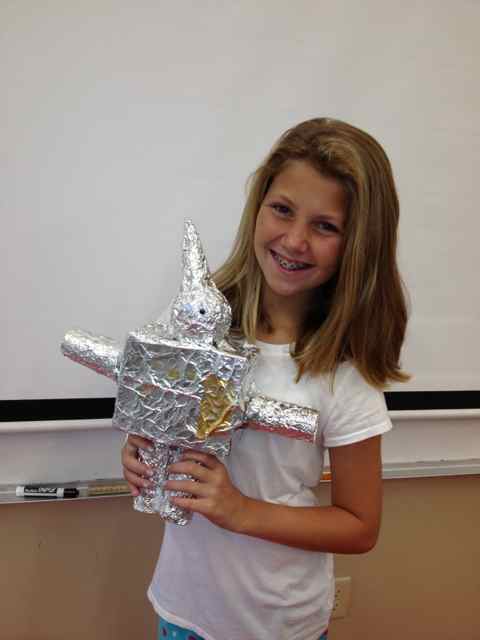
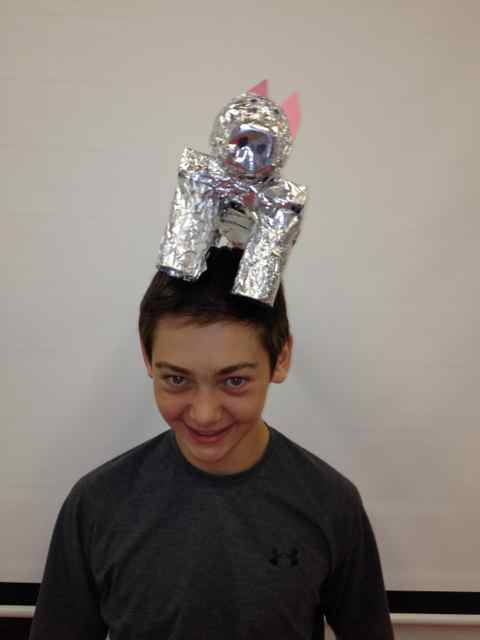
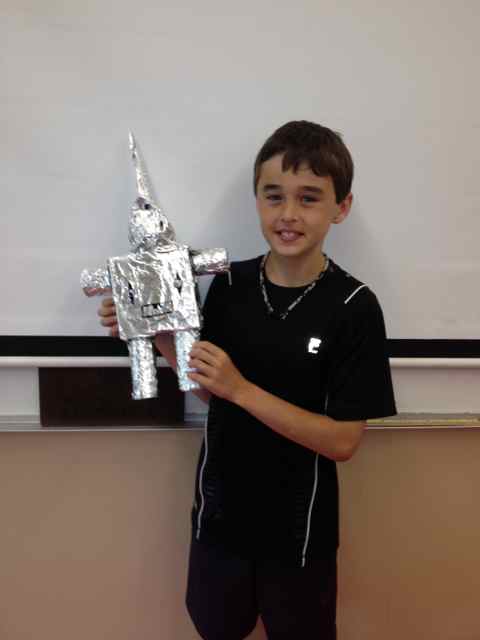
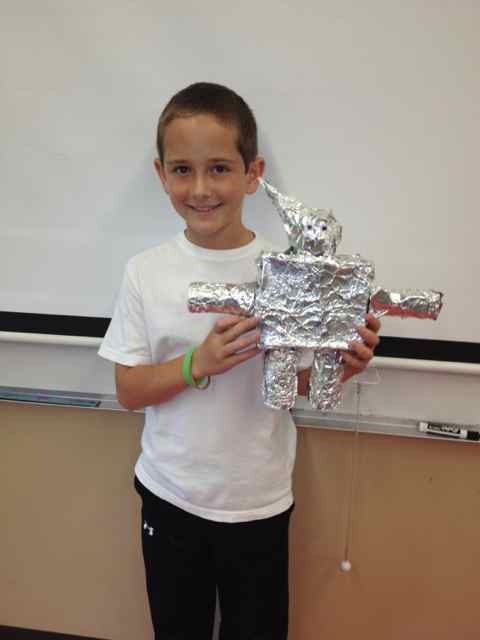
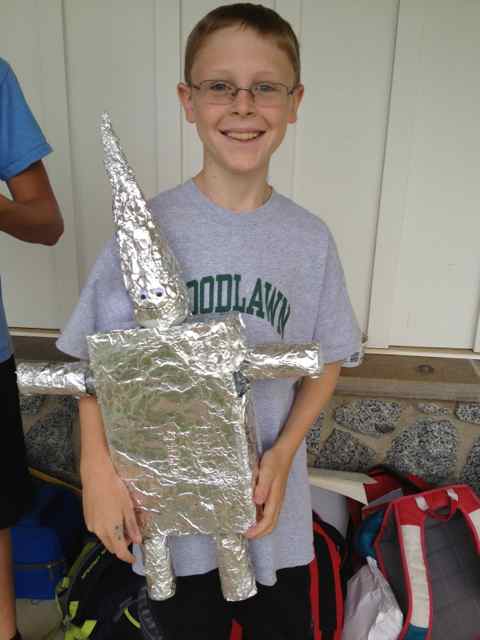
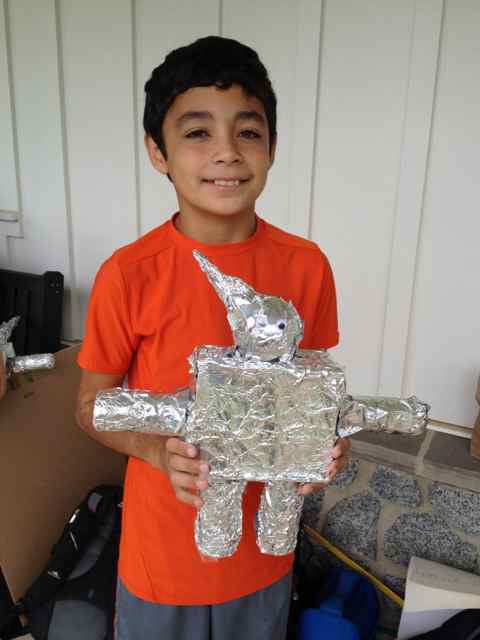
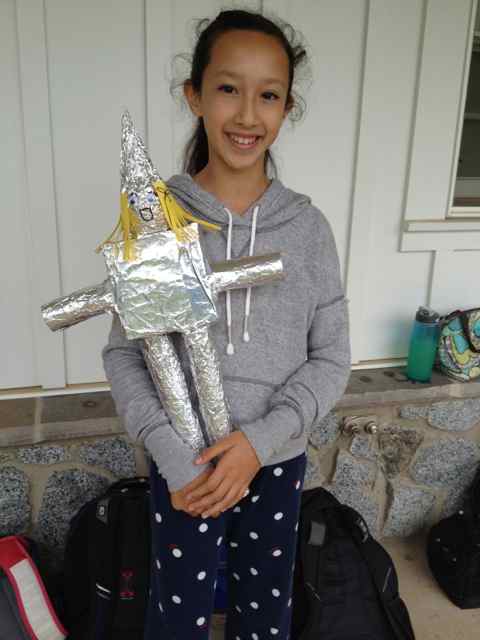
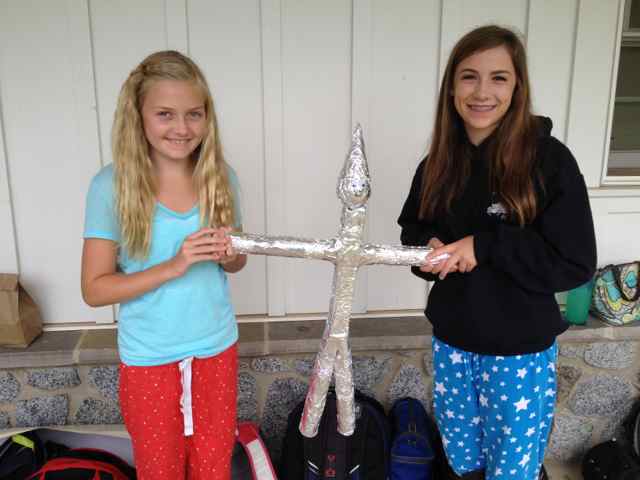
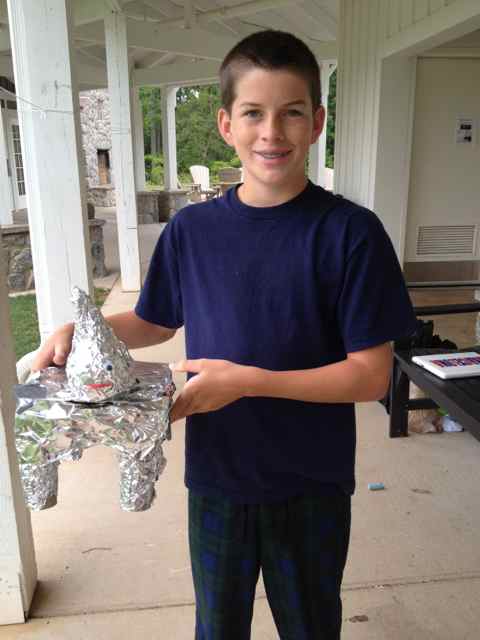
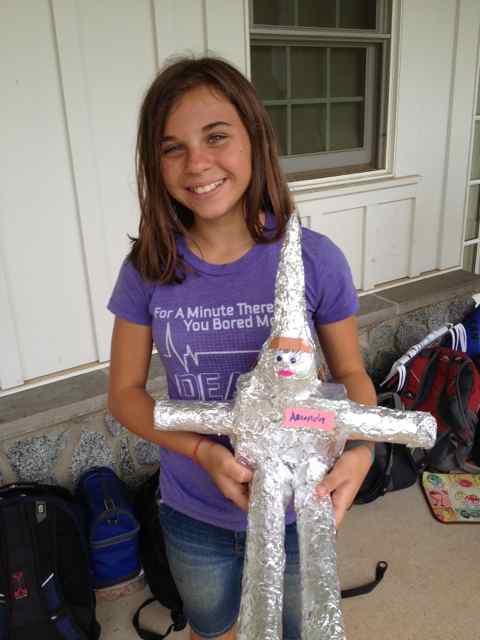
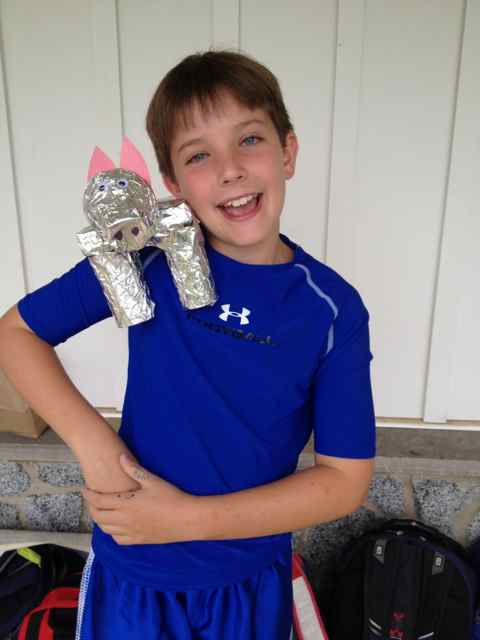
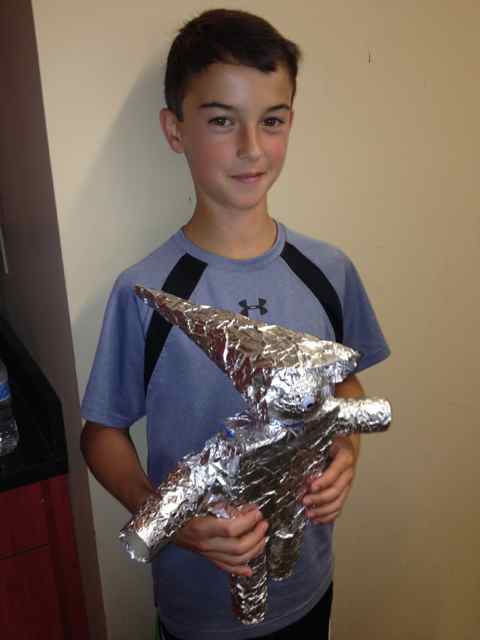
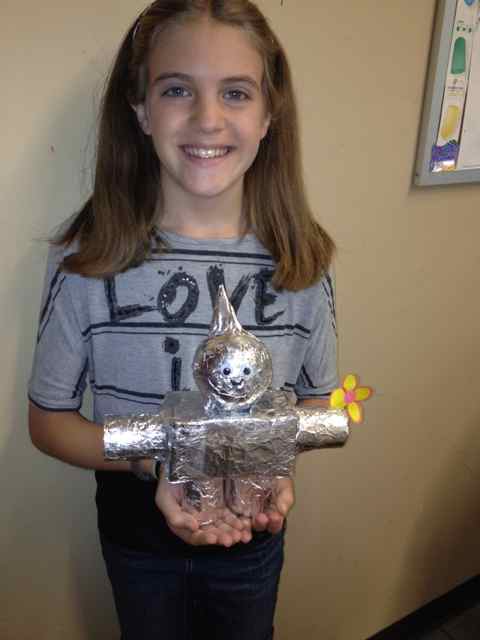
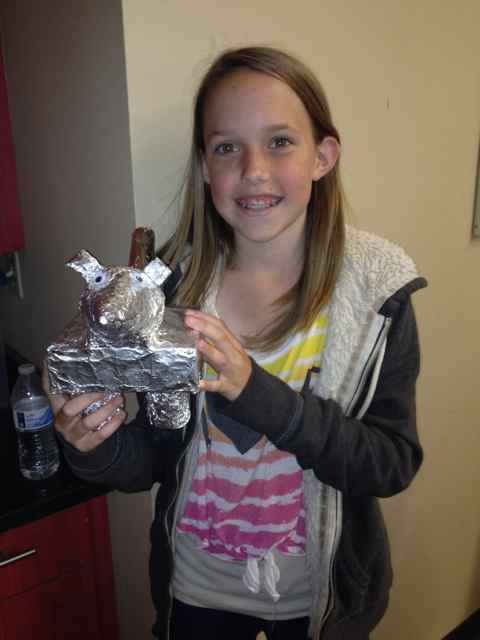
I read about the amazing Tin Man project on Elissa’s blog Misscalcul8. Please go there and read all about it in more detail! I had to duplicate it for my 6th grade students. They love being creative and surface area is tricky.
At their request, I let them make a tin man or animal. The students chose their materials (they had to have a cylinder, a rectangular prism, a sphere, and a cone). They then had to measure their materials and find the surface area of each item. (My Tin Man Project Worksheet). After the surface areas were calculated, they added it all up to find the total surface area of their tin man and how much foil they would need to completely him. I created a Google Spreadsheet to automatically check all of their answers according to the measurements they had recorded. This was essential for grading ease since every student had different materials and thus different measurements. Then, they taped their tin man together, measured and cut the foil, and covered their tin man/animal in tin! After they finished, I had them do Elissa’s reflection as well. To save paper (and printing issues that students always have), I uploaded the questions to Google Documents. Students had to copy the document to answer the questions, and then share it with me for grading.
A best aspect of the project was applying the aluminum foil to their tin men. The students had calculated how much foil they needed to cover their man using surface area. Once cut, if the amount of foil was too little or too much, they had to meet with me to talk about why this happened. It was math in action!
Another great piece of the project was coming up with how much foil to cut. They had to take their total surface area and divide it by the width of the foil roll (30 cm) before cutting the foil. I made them figure this out before cutting the foil to deepen their thinking about area. They then had to talk about why they divided my 30 in their reflection. It was great to see that every student did understand why they divided by 30.
This project took longer than I thought it would, but was worth it. On the unit test, my students scored better on surface area than on volume, even with the Play-doh activity! Their biggest challenge were actually applying the foil to the tin men. Next year, I will have them apply the foil first, then tape their tin men together. They also wanted more time to decorate their tin men, but I had too much I wanted to squeeze in at the end of the year to give them an extra day. Next year I will try to build in one more day.
I can’t thank Elissa enough for this project idea OR all of the help and suggestions that she gave me via email. I love all of the fabulous math teachers in my PLN and am such a better teacher because of them! Reach out teachers and connect with each other on Twitter. Read their blogs, try their ideas. It makes teaching a blast, and the students love it. Everybody wins!
The “Survey” project is my favorite project of the year because it combines technology, creativity, and collaboration. This project incorporates three different Google Documents, word, spreadsheet, and presentation (two groups even created a Google Form). The students create their own survey question and decide how to best display their data. Students also have the option to work together. My students love working with each other, being creative, and technology so they are completely engaged throughout the project.
Working individually or in small groups, students created a survey question, then determined their population and their sample. I created a survey form on Google Docs that they had to duplicate, fill out, and share with me to gain approval for their survey questions. The Google Document was very useful as I could make suggestions with the “comment” feature while they were working on them.
Once they had approval, they were off to collect data. I have given them several surveys over the past year using Google Forms and I was very impressed with a couple of groups that created their own Google Form to collect their data.
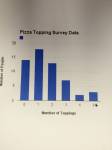
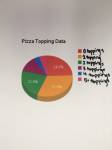
Students created a Google Spreadsheets to analyze and display their data. They have used Google spreadsheets in my class before, but have not created their own. They first made frequency tables and then created a chart of their choice to display their data.
Once their charts were created in a Google Spreadsheet, they inserted them into a Google presentation. I created a single Google presentation in which they all were to add their charts. This way, I have all of their results in one place. I love doing this for two reasons. Having all of their work in one document is wonderful on presentation day because we do not have to wait for every student to access their own document when it is their turn to present. It also makes it very easy for me to grade.
A great result of this project is that I now have one amazing and creative document made by the students to teach with not only this year, but also for future years. I had the current students come up with two math questions relating to their chart(s), and the answers to the questions on the next slide. This year, students will ask the questions of their peers as they present. Next year I can use this document full of bar graphs, double bar graphs and pie charts to teach other students. My current students are very excited that I plan to use their projects to teach next year’s students. And, I believe that my future students will be more interested in the learning about these charts because they were created by students. Everybody wins!
We are so excited! My students’ answers to a “Solve It!” were published in the November edition of Mathematics Teaching in the Middle School. This is a national publication produced by the National Council of Teachers of Mathematics. The students collected data about the number of jeans owned by every student in their class. Working in groups of three or four, they used Google Spreadsheets to compare their class average to the national average and to do further analysis of the data. They created graphs to visually present their findings. They also worked collaboratively on a Google word document to write their analysis of the data. After they came up with conclusions, they created wiki pages to present their findings. Their wiki pages were creative and beautifully formatted. They contained uploaded graphs of their data, detailed analyses, and even some pictures they took with their cameras or computers.
We had already covered the unit on averages when the “Solve It!” question came about. Therefore, I gave few instructions to the students for this project. I showed them the question in the article and let them work independently in their groups. I encouraged them to be creative. They loved this project and they reported that much of their enthusiasm was due to the freedom they were given.


 I appreciated that there were several related questions. This made students aware that they had made a mistake in a previous question so they knew they had to go back and rethink it.