Creating Tin Men to Explore Surface Area Project

I read about the amazing Tin Man project on Elissa’s blog Misscalcul8.  Please go there and read all about it in more detail!   I had to duplicate it for my 6th grade students.  They love being creative and surface area is tricky.

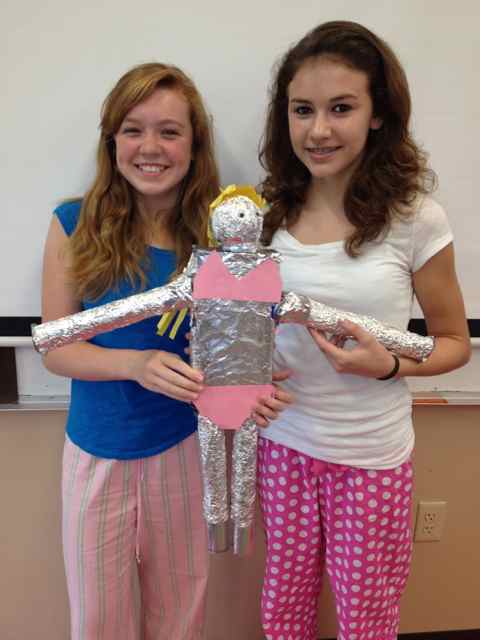
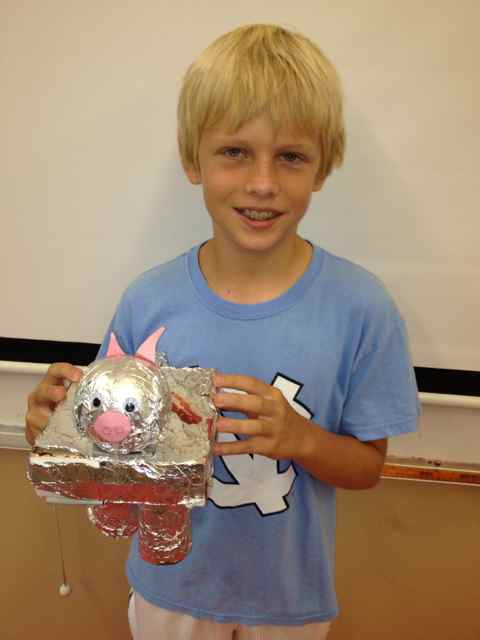
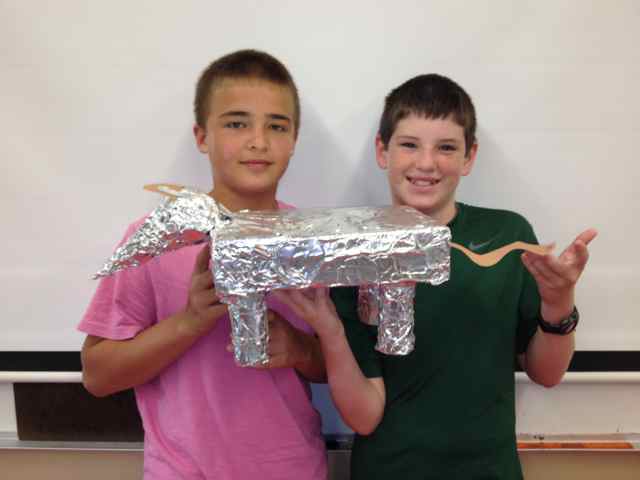
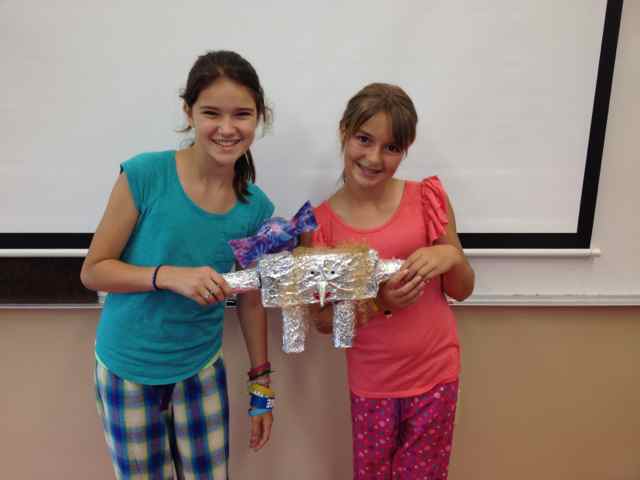
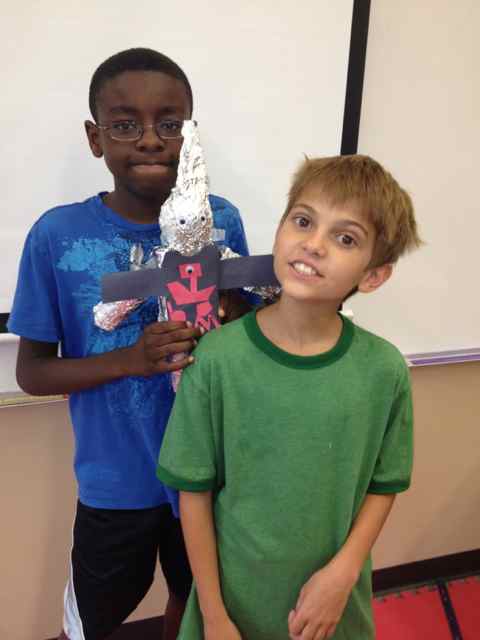
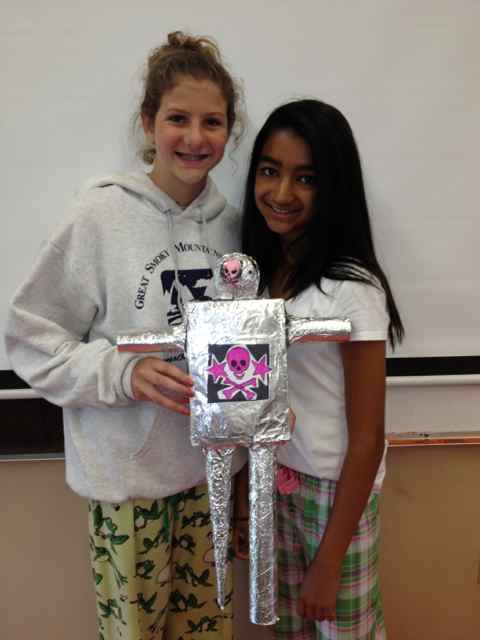
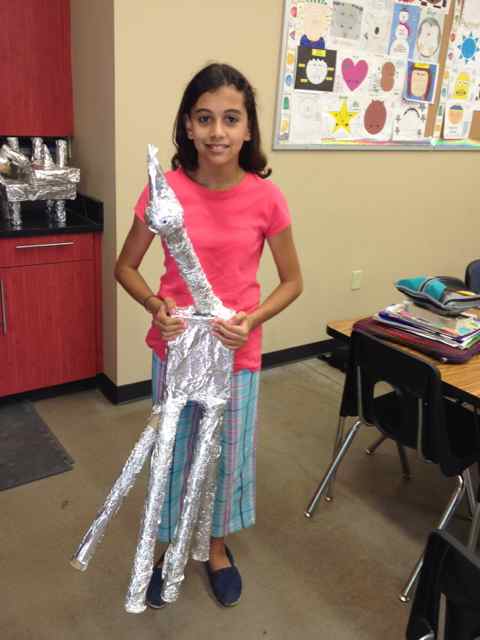
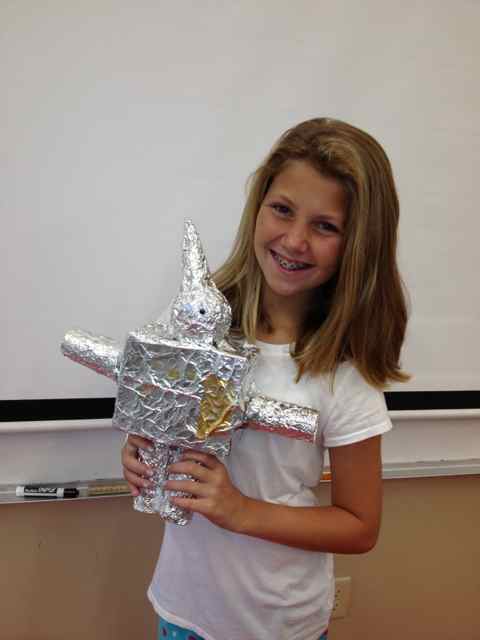
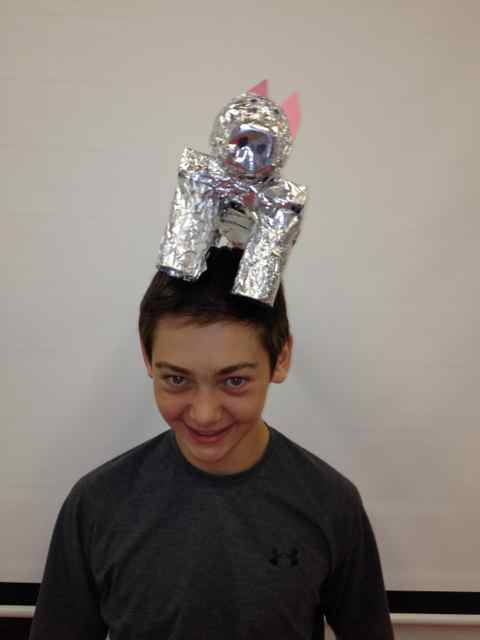
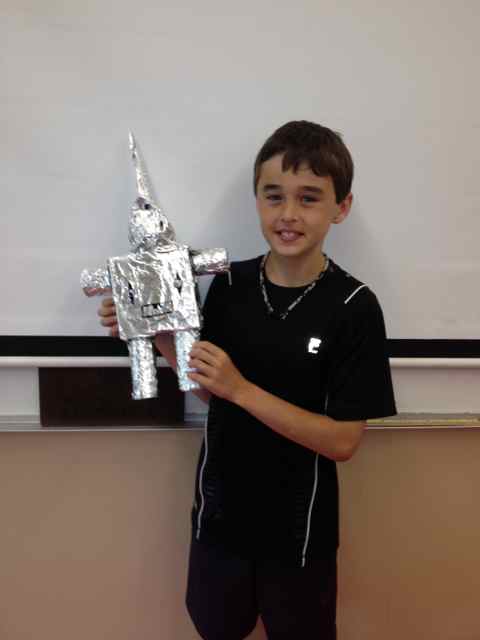
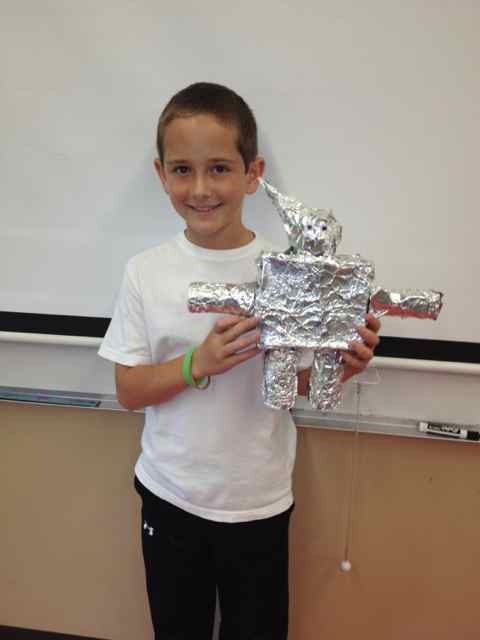
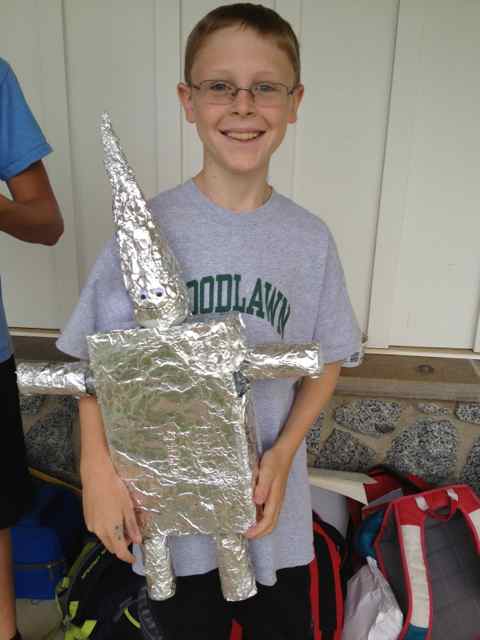
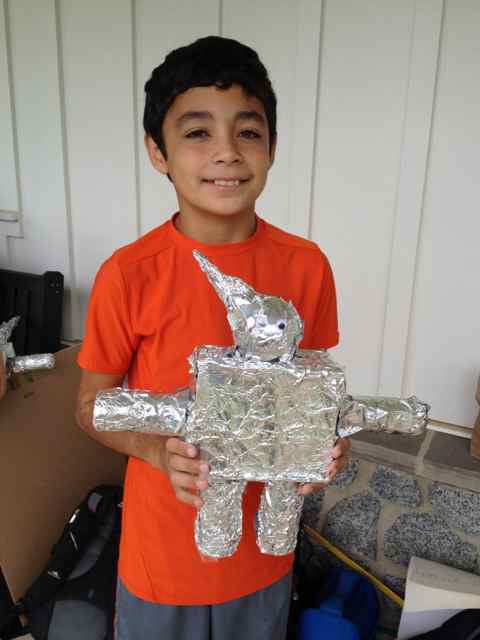
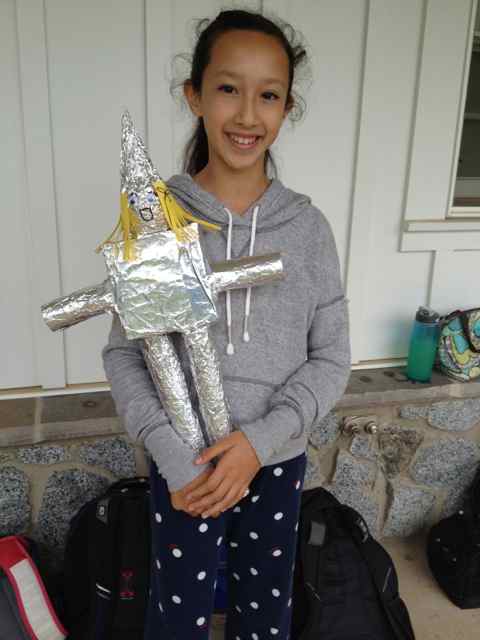
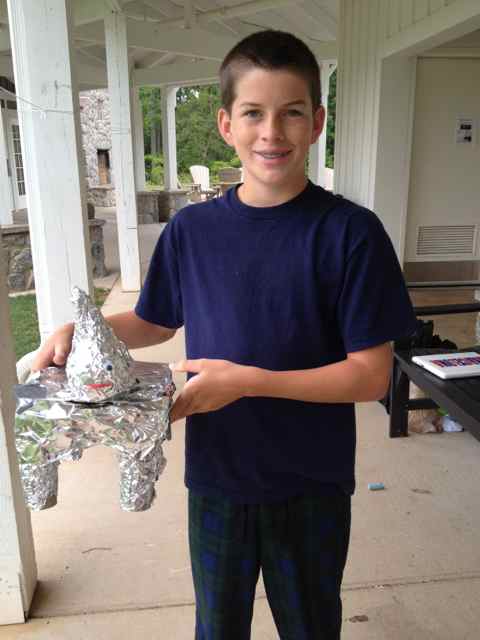
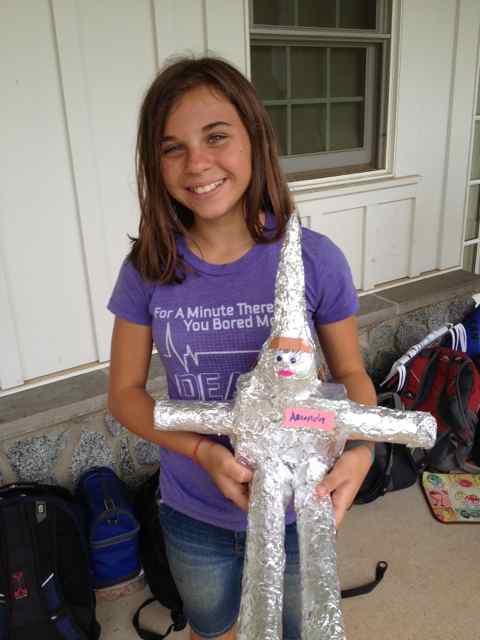
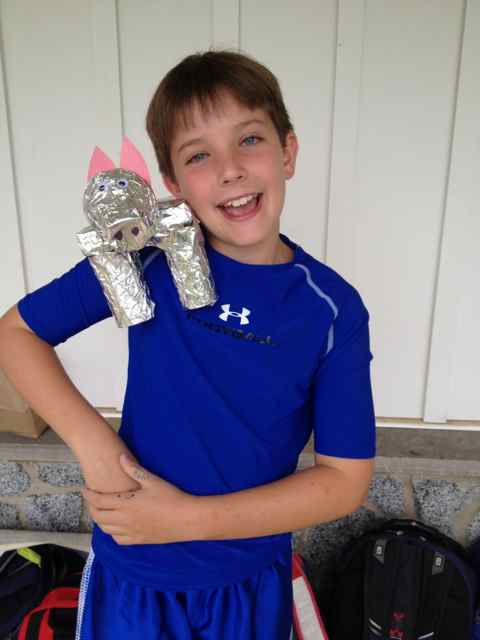
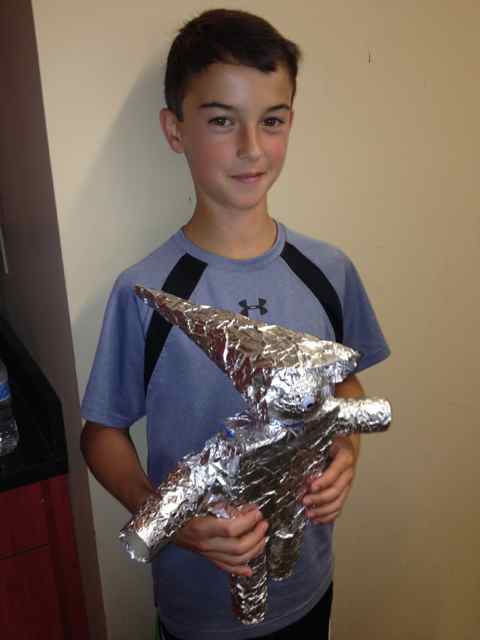
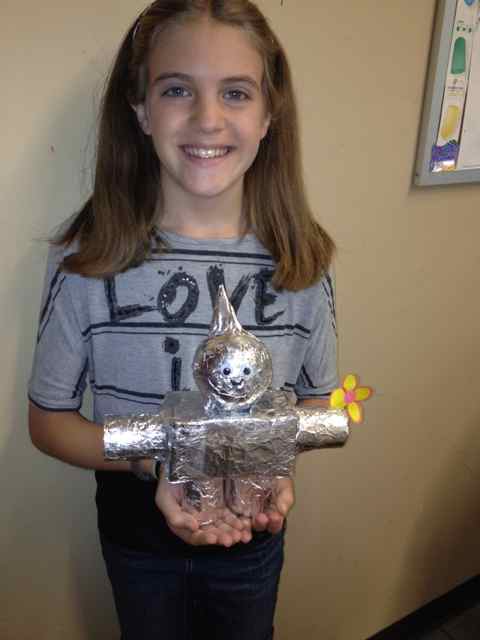
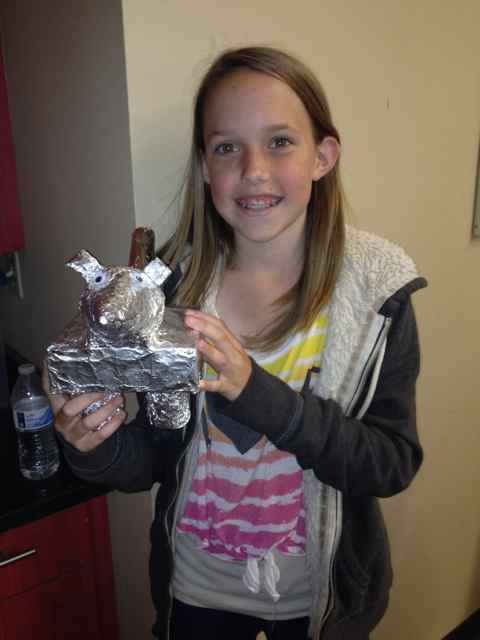
At their request, I let them make a tin man or animal.  The students chose their materials (they had to have a cylinder, a rectangular prism, a sphere, and a cone).  They then had to measure their materials and find the surface area of each item.  (My Tin Man Project Worksheet).  After the surface areas were calculated, they added it all up to find the total surface area of their tin man and how much foil they would need to completely him.  I created a Google Spreadsheet to automatically check all of their answers according to the measurements they had recorded.  This was essential for grading ease since every student had different materials and thus different measurements.  Then, they taped their tin man together, measured and cut the foil, and covered their tin man/animal in tin!  After they finished, I had them do Elissa’s reflection as well.  To save paper (and printing issues that students always have), I uploaded the questions to Google Documents.  Students had to copy the document to answer the questions, and then share it with me for grading.

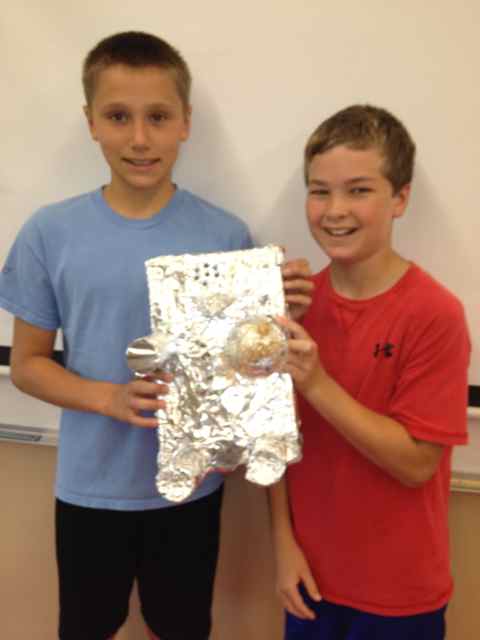
A best aspect of the project was applying the aluminum foil to their tin men.  The students had calculated how much foil they needed to cover their man using surface area.  Once cut, if the amount of foil was too little or too much, they had to meet with me to talk about why this happened.  It was math in action!

Another great piece of the project was coming up with how much foil to cut.  They had to take their total surface area and divide it by the width of the foil roll (30 cm) before cutting the foil.  I made them figure this out before cutting the foil to deepen their thinking about area.  They then had to talk about why they divided my 30 in their reflection.  It was great to see that every student did understand why they divided by 30.

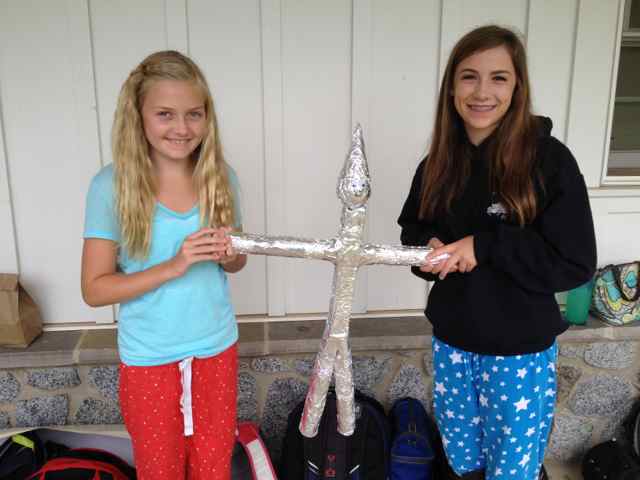
This project took longer than I thought it would, but was worth it. On the unit test,  my students scored better on surface area than on volume, even with the Play-doh activity!  Their biggest challenge were actually applying the foil to the tin men.  Next year, I will have them apply the foil first, then tape their tin men together.  They also wanted more time to decorate their tin men, but I had too much I wanted to squeeze in at the end of the year to give them an extra day.  Next year I will try to build in one more day.

I can’t thank Elissa enough for this project idea OR all of the help and suggestions that she gave me via email.  I love all of the fabulous math teachers in my PLN and am such a better teacher because of them!  Reach out teachers and connect with each other on Twitter.  Read their blogs, try their ideas.  It makes teaching a blast, and the students love it.  Everybody wins!

** Edited 4/27/16:  I added the Google Spreadsheet to check the formulas.  

Survey Project – Creativity, Collaboration, and Technology

The “Survey” project is my favorite project of the year because it combines technology, creativity, and collaboration.  This project incorporates three different Google Documents, word, spreadsheet, and presentation (two groups even created a Google Form).  The students create their own survey question and decide how to best display their data.  Students also have the option to work together.  My students love working with each other, being creative, and technology so they are completely engaged throughout the project.

Working individually or in small groups, students created a survey question, then determined their population and their sample.  I created a survey form on Google Docs that they had to duplicate, fill out, and share with me to gain approval for their survey questions.  The Google Document was very useful as I could make suggestions with the “comment” feature while they were working on them.

Once they had approval, they were off to collect data.  I have given them several surveys over the past year using Google Forms and I was very impressed with a couple of groups that created their own Google Form to collect their data.

Students created a Google Spreadsheets to analyze and display their data.  They have used Google spreadsheets in my class before, but have not created their own.  They first made frequency tables and then created a chart of their choice to display their data.

Once their charts were created in a Google Spreadsheet, they inserted them into a Google presentation.  I created a single Google presentation in which they all were to add their charts.  This way, I have all of their results in one place.  I love doing this for two reasons.  Having all of their work in one document is wonderful on presentation day because we do not have to wait for every student to access their own document when it is their turn to present.  It also makes it very easy for me to grade.


 A great result of this project is that I now have one amazing and creative document made by the students to teach with not only this year, but also for future years.  I had the current students come up with two math questions relating to their chart(s), and the answers to the questions on the next slide. This year, students will ask the questions of their peers as they present.  Next year I can use this document full of bar graphs, double bar graphs and pie charts to teach other students.  My current students are very excited that I plan to use their projects to teach next year’s students.  And, I believe that my future students will be more interested in the learning about these charts because they were created by students.  Everybody wins!

My Students were Published in Mathematics Teaching in the Middle School!

We are so excited!  My students’ answers to a “Solve It!” were published in the November edition of Mathematics Teaching in the Middle School.  This is a national publication produced by the National Council of Teachers of Mathematics.  The students collected data about the number of jeans owned by every student in their class.  Working in groups of three or four, they used Google Spreadsheets to compare their class average to the national average and to do further analysis of the data.  They created graphs to visually present their findings.  They also worked collaboratively on a Google word document to write their analysis of the data.  After they came up with conclusions, they created wiki pages to present their findings.  Their wiki pages were creative and beautifully formatted.  They contained uploaded graphs of their data, detailed analyses, and even some pictures they took with their cameras or computers.

We had already covered the unit on averages when the “Solve It!” question came about.  Therefore, I gave few instructions to the students for this project.  I showed them the question in the article and let them work independently in their groups.  I encouraged them to be creative.  They loved this project and they reported that much of their enthusiasm was due to the freedom they were given.

Check out the wiki pages they created  and read the Solve It! Article.

Jeans Solve It Published