Today I went with our amazing MS Art teachers to the Discovery Place to see the Van Gogh Alive exhibit. It was amazing. I highly recommend going to see it if it comes to a city near you! It was vey moving.
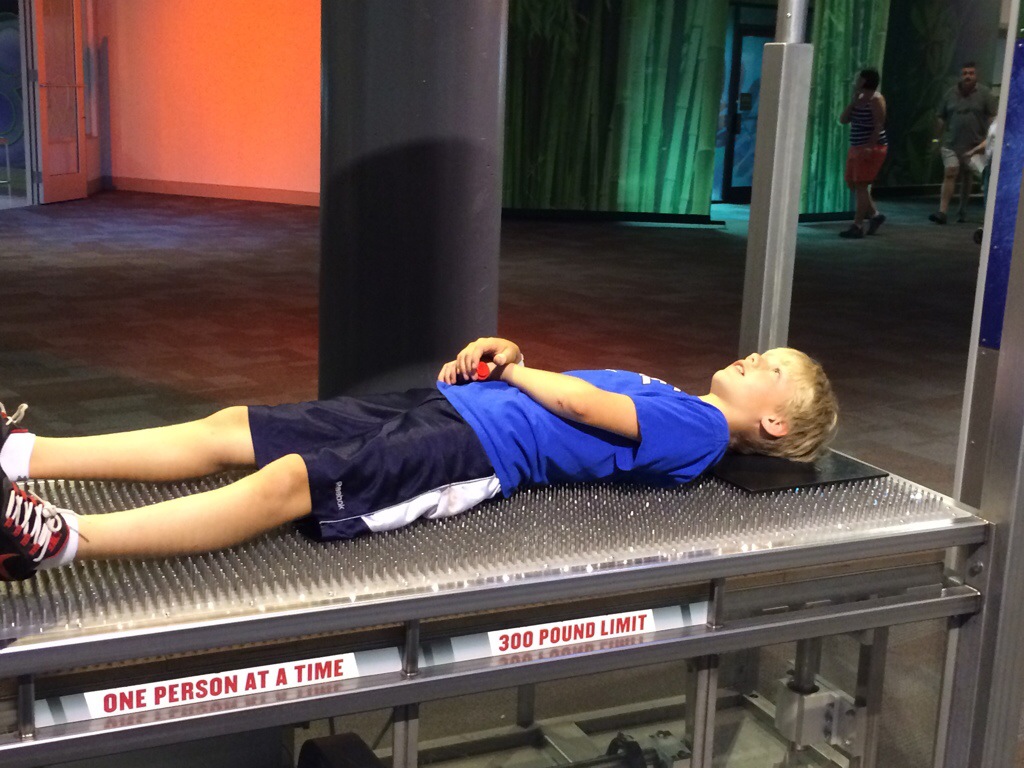
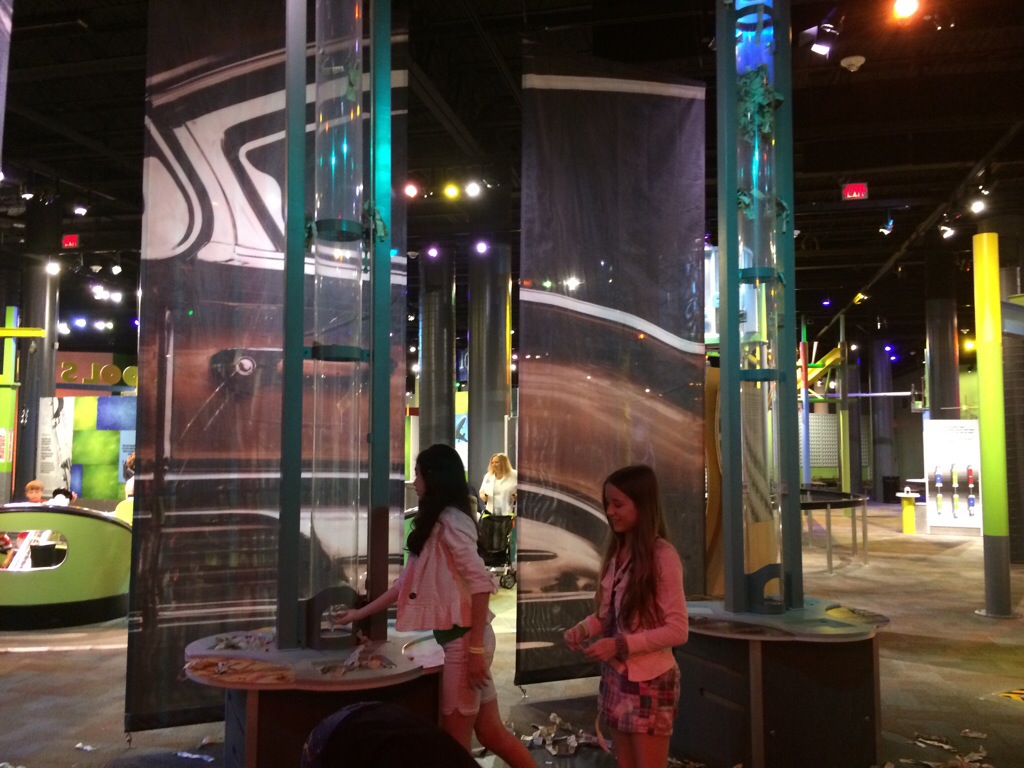
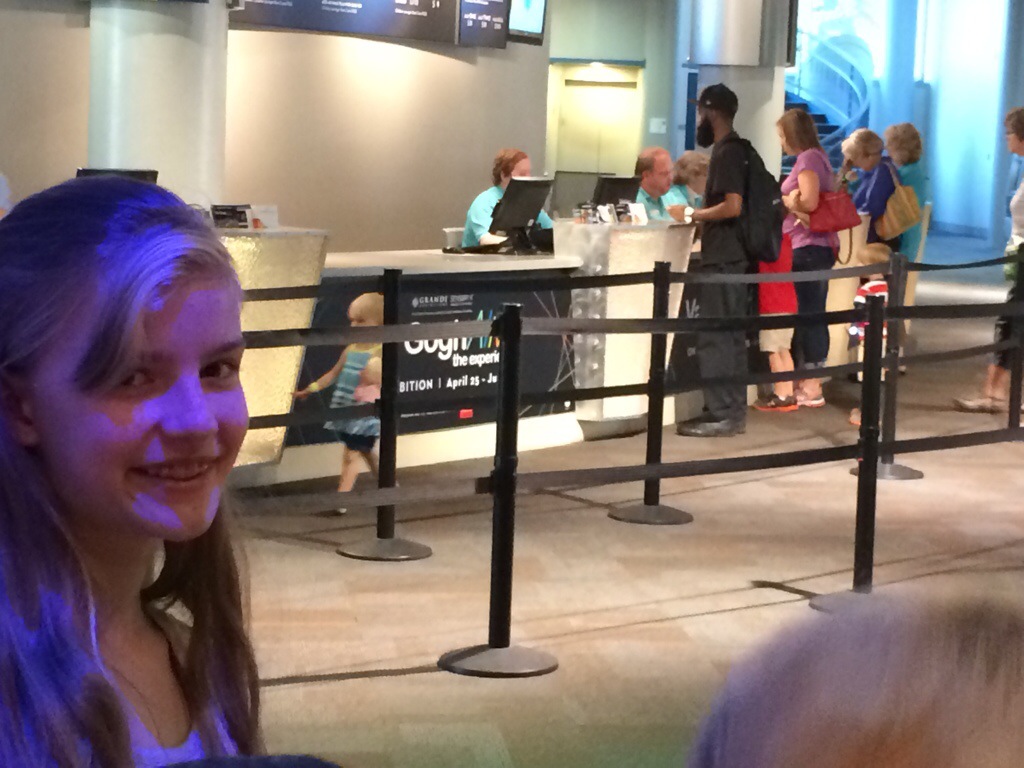
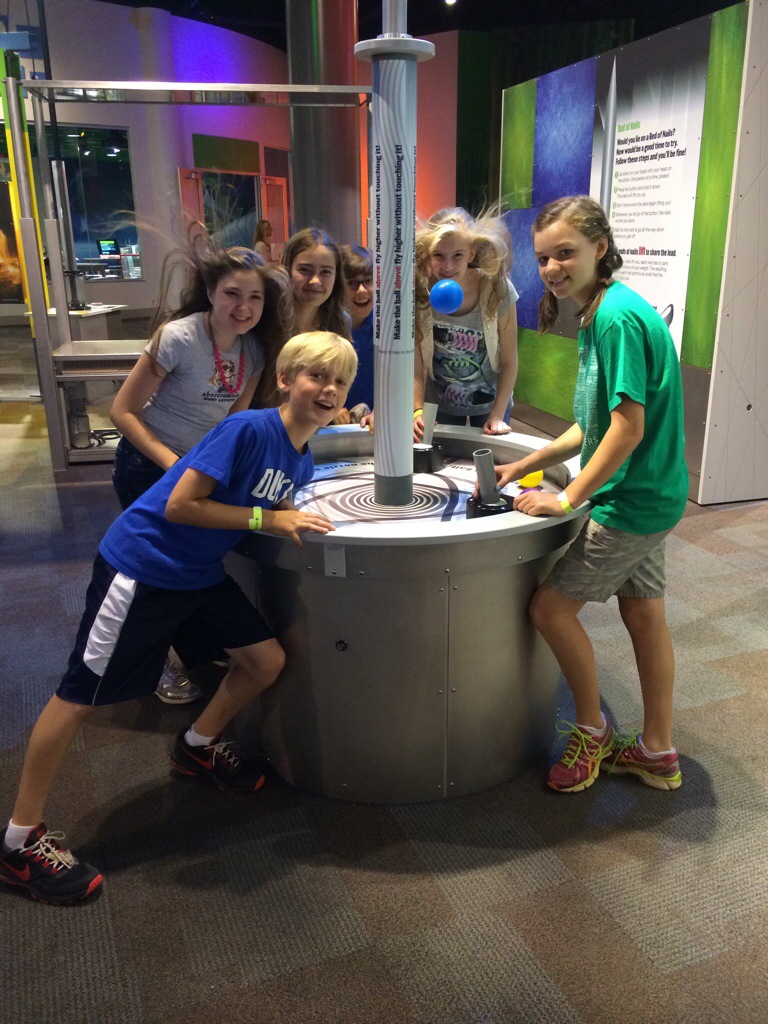
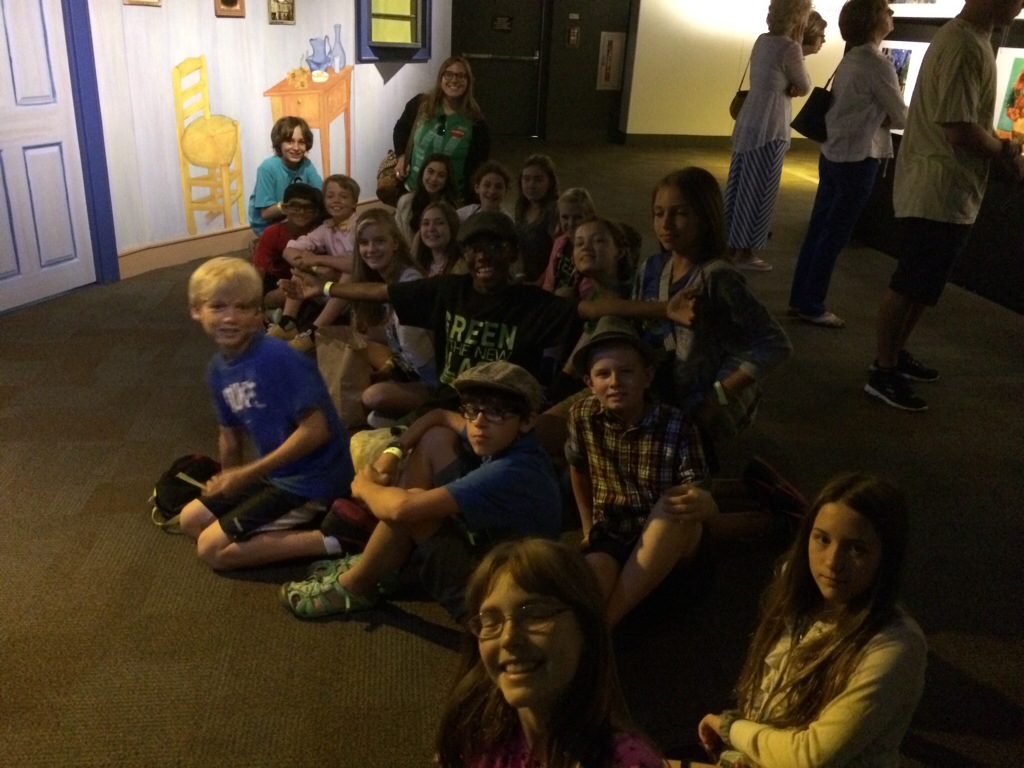
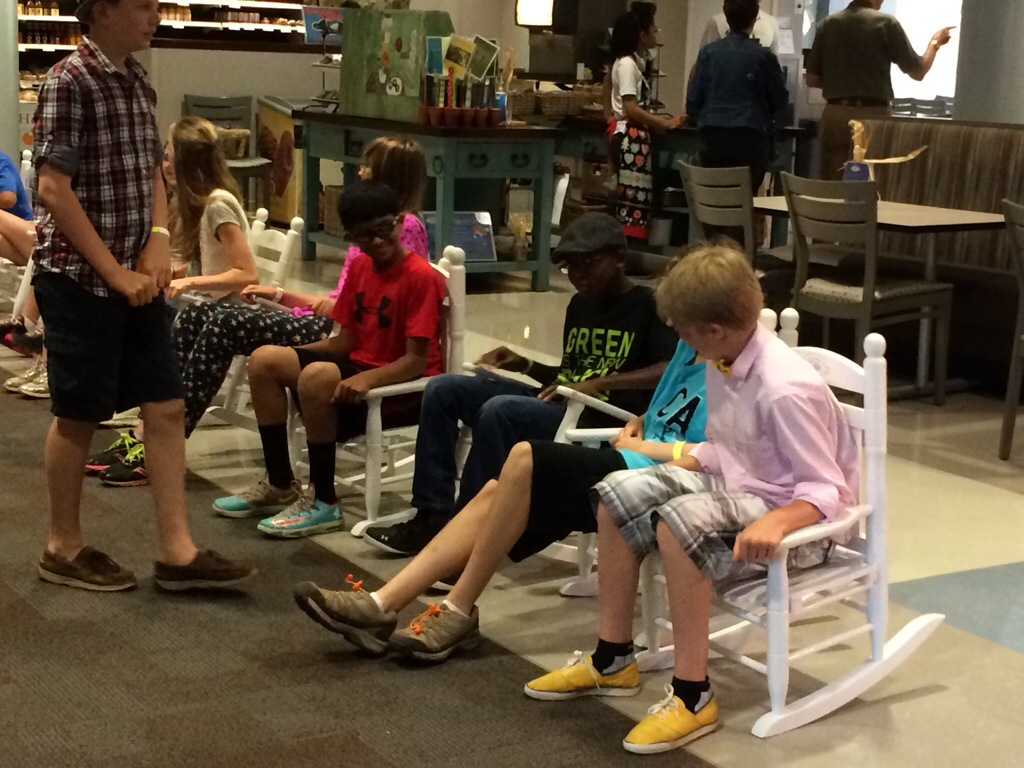


Today I went with our amazing MS Art teachers to the Discovery Place to see the Van Gogh Alive exhibit. It was amazing. I highly recommend going to see it if it comes to a city near you! It was vey moving.
In seventh grade we do an integrated cross curricular culminating project called “Architecture as Activism”. The students select a region that have learned about in social studies this year. They then design a building that will address a need in that region. Their building must reflect the culture, geography, and ecology of the region. There are other aspects to the project as well, including an action plan and a letter, so it spans all of the disciplines.
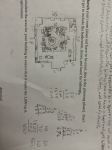
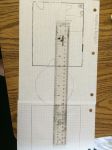
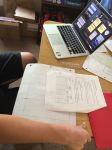
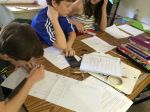
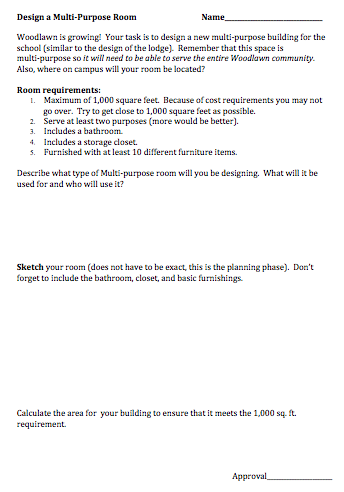
I start the culminating project off in math. We first learn about floor symbols and floor plan scale. Before they start their culminating project, they do a mini-project so they can learn about and practice scale and area. For their mini-project they get to design a new multi-purpose building for our school. It has to be under 1,000 square feet and must include a bathroom, a storage closet, and some furniture. Since 1,000 square feet is pretty small many of my students are adding outdoor features and courtyard. Interesting building configurations make excellent area problems. Also, students do not realize how small 1,000 square feet really is. They have to make tough choices or be creative enough to make it all fit.
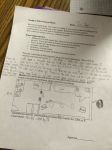

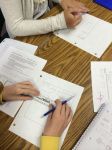
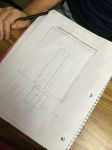

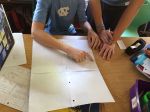
Design a Multi-Purpose Building Project Sheet


I’m so excited about the “Hour of Code”. And, after showing my students some of the promo videos today, they were excited too! So excited that they begged me for the link so that they could start tonight. Visit csedweek.org for all of the details!
The goal is to have 10 million students participate in coding this week. Here is why you should do it with your students.
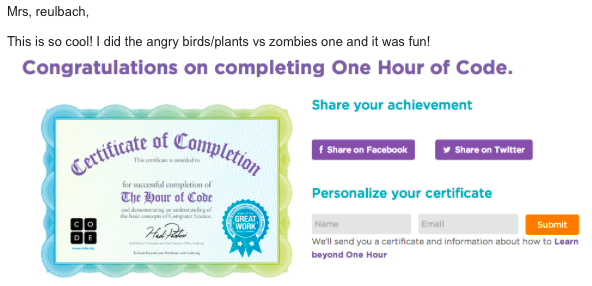
After I gave them the link, students were already working on it today in their free time and at home tonight. One student emailed me her certificate of participation after completing the first tutorial!
“This is so cool! I did the angry birds/plants vs zombies and it was fun!”
Here is an “Hour of Code” Walkthrough video for teachers. I watched this first. I am doing our hour tomorrow in class and will let you know if I have any tips.
I discovered the books, “If the World Were A Village” by David Smith at a local math conference two years ago. I would love to explore the math in this books with my class but have not come up with a good lesson for it yet. I am posting about this now to get my links together, inspire myself, and maybe get some ideas from the amazing math teachers that read my blog.
If you have lessons or activities surrounding this concept, please share them in the comments with me! Once I get something together, I will tell you all about it.
Links I like about 100:
I totally stole this from the amazing Sean (thanks Sean!). But, I could not resist! It is right up my teaching alley with all of the singing and dancing! I changed some of the words to suit the steps that I have my students use. We added motions too, like the CLAW (aka distributive property)! I was able to integrate with our dance teacher. She organized the students and cleaned up their steps. We even added a checkmark formation at the end! (Yes, that is what they are doing if you can’t tell. Checkmarks are hard to make!) Of course I made a video of their performance and then an iMovie to share. But, I did not get around to having my students Flash Mob this in the carpool line after school. There is always next year!
Man, I love my job.
Dance Steps to Solving Multi-Step Equations
First you clear your fractions, LCD and CLAW action!
Then you distribute and you do the CLAW scoot!
Then you simplify, put your hands up in the sky!
Then you combine like terms and you do the squirm.
Add and subtract, x-terms alone on one side, so take a step back and do a big slide.
Multiply and divide, the answer you will learn when you jump to the left and do a full turn.
Now, check, check, check, check, check,……..
As much as I love teaching math, sometimes wish I taught social studies. History is so much fun!
In our 6th grade curriculum the students do a interdisciplinary project on the Middle Ages. They study the Middle Ages in Social Studies, read period books and fairy tales in Language Arts, create Middle Age art, and even learn popular dances from the Middle Ages in dance class. With all of the Middle Age fun coursing through the 6th grade, I could not be left out in math class!
The Land Of Matheval
I created “The Land of Matheval” for our Medieval Mathematics Unit. Matheval was a fictional medieval community comprised of my 25 6th grade students. I let all of my students pick a person from the Middle Age to become and research. We were studying percents, ratios, and rates so I wanted to look at the percentages of the different classes of people of the Middle Ages. To study rates, I decided to focus on the death rate of the Black Death across Europe.
Day 1: Percent of the Population
When people think of the Middle Ages, they often think of Kings, Queens, and knights. However, nobility was only about 1% of the population. In our class we investigated the percentage of the Medieval population that was nobility (1%), monks and priests (5-10%), and commoners (90%). We then took those percentages and applied them to our 25 6th graders to see how many of each class we would have. We had to do a little rounding and estimating so that we didn’t end up with half a person. We ended up with 1 member of nobility, 1 monk and 1 priest, and 22 commoners. The students were quite surprised that there was only one member of nobility among us!
Day 2: Draw Your Role
I had the students draw their role from a hat to decide if they would be nobility, clergy, or common. After drawing, we talked briefly about roles of commoners in the Middle Ages. They had been discussing this in more depth in Social Studies so were already familiar with the roles. The commoners got to pick a job. For part of their homework, they were to enter their job and provide a brief description of their responsibilities on a Google Document that I created. I told them that since we were such a small community they could not duplicate jobs.
Day 3: Estimate Your Chance of Survival
After they picked their roles I told them that we would be studying the Black Death. I explained that many people in Europe died from the Black Death. For part of their homework that night, they were to go onto their Google Docs and estimate their chance of survival according to the job that they had picked. This was when the students realized it was NOT a good time to have picked being a rat catcher!
Day 4: Rate of Death – The Black Death Arrives!
This day was one of those amazing teaching days that you wish you could have every, single day! I arranged for the art teacher to dramatically interrupt our class to announce that the Pestilence had arrived! What I didn’t know was that our art teacher was also the director of our school theatre productions OR that the social studies teacher would also join in the fun! About five minutes into class, the art teacher exploded through our door screaming, “The Pestilence has arrived!” before dropping dead in our doorway. She was then dragged out by their social studies teacher. This was immensely entertaining and made QUITE an impression on my students! With urgency, I told our students that our plans must stop at once today! We needed to stop everything and learn more about THE BLACK DEATH!
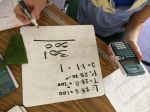
We discussed the spread of the Black Death throughout Europe by analyzing graphs and charts I had on a Powerpoint. We researched the population of Europe from 1347 to 1352 and discovered that 25 million people had died in 5 years. We then calculated how many people died each year, each month, and each day! As we continued on with our calculations, the numbers became more and more manageable (and thus realistic) for the students. They wanted more, so we then calculated how many people died each hour and finally, how many people died each minute.
We discovered that an average of about 10 people died every minute during that time period in Middle Ages. What did this mean for Matheval? For our small class of 12 it meant that we could all be dead from the Black Death in about 60 seconds. What could I do but set a giant timer on the overhead projector? At this, the students actually began to panic. My classroom became a flurry of voices, “The Black Death is here!”, “I don’t want to die from the Black Death!”, and “Let’s get out of here!” Then, they asked me something unexpected. They asked me, “Mrs. R, can we leave?” At this point, what could I tell them but, “YES! If you want to leave – GO!” At that, they all RAN out of the door, and kept running! They ran in all directions! They ran completely across the entire soccer field. And still, the time was counting down. When the timer went off I screamed out the door, “TIMES UP!! You are all DEAD!” This is when they did something else I did not expect, they all “dropped dead” right where they were. They were quite the spectacle! I wish I would have anticipated this, as I would have loved to post those pictures to this post! But, I was too caught up in the moment. What else could I do now but loudly sing, “Bring in your dead! Bring in your dead!” (You should never miss a chance for a Monty Python moment!)
When the class was back, seated and winded, we discussed what had happened. At hearing the Black Death was coming, what did all of my students do? THEY RAN. What happened to them anyway? THEY ALL DIED. But, what did they do in the meantime? They spread the Black Death across the entire Woodlawn Campus! We talked about how this was human nature, and many people in Europe probably reacted the same way that they did. They fled, and they spread the Black Death.
I then opened the Google Doc and we looked at their estimated chance of survival. After what we learned about the rate of death, we updated their percentages as a class.
It was a fantastic week, it was an amazingly fun lesson, and my students have not stopped begging for more activities like the Black Death!
The 7th grade class at my school is currently working on a cross-curricular Japanese Anime project where they creating their own stop-motion animated films based upon environmental themes. The students work in groups and come up with their own idea relating to the theme, the characters they would like to use, and how they would like to present their message. Then, in the classic stop-motion animation style, they take a series of pictures that they edit in imovie to create an animated film.
The project, The Animated Classroom: Using Japanese Anime to Engage and Motivate Students, was recently written up in the September edition of the English Journal. For the math aspect of this project, the students read and timed their entire movie, and then read and timed each scene. The art teacher and her previous students had determined that they would need 2-3 pictures per second to make the animation appear “smooth”. So I had my students calculate the range for the number of pictures they would need for their total movie and for each scene based on this estimate. It is important that the students take enough pictures as it is often difficult to go back and take more pictures once the shooting is over.
The students take all of the shots and do their own editing. The characters in their movies can be anything from lego figures to barbies and paper dolls, or they can draw on a whiteboard. An interesting part of the project for students is determining the angles to take the shots from, and how much they should pan or zoom. Since the characters aren’t alive, it would be very boring (and not very animated) for the characters to be just standing facing each other during the talking.
Fortunately, I am friends with Matt Clark, the two-time Emmy nominated Director of Photography of the NBC hit show 30Rock. With this project looming, and all of these camera angle questions in mind, who else better to ask than an extremely talented and exceptionally good-natured cinematographer?
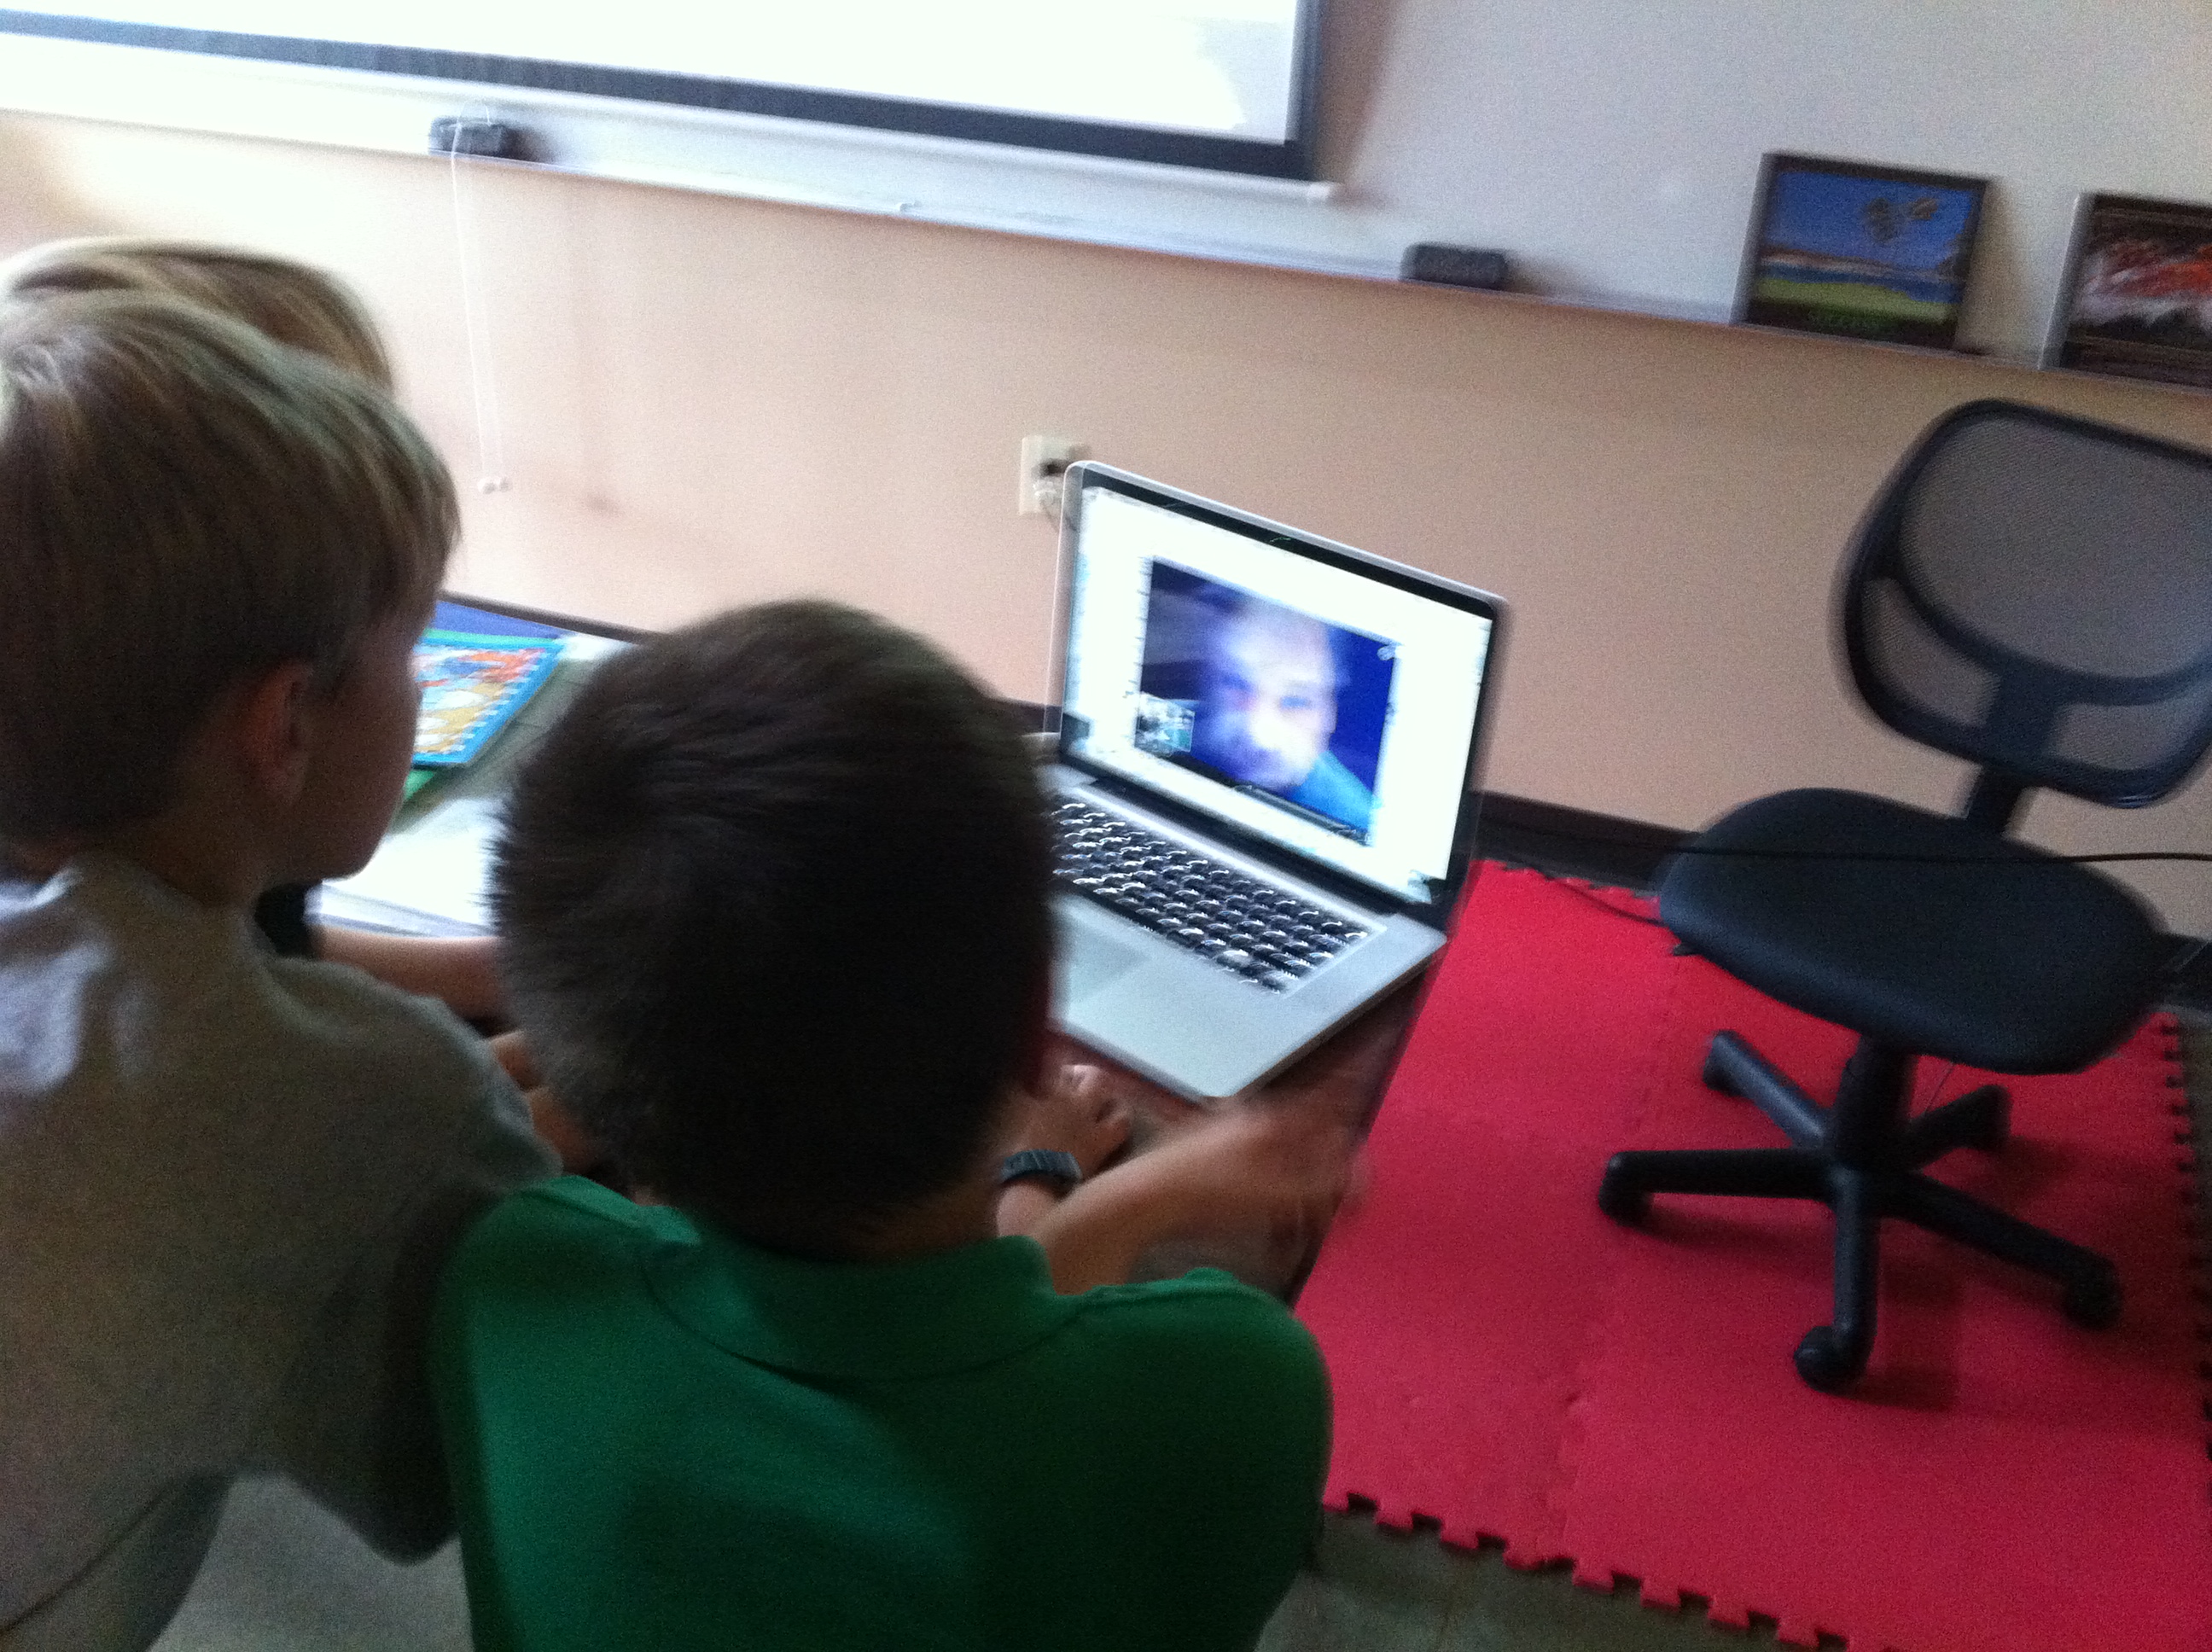
Thanks to Skype, we were able to live stream Matt into my NC classroom directly from 30Rock’s NYC set! Thanks to a overhead projector, we were able to put his face on the BIG screen! However, for him to see the students, they had to sit in front of the computer when they asked their questions. We also hooked into the sound system in the room, and it was great hearing his voice overhead! But there was too feedback, so we had to go back to computer audio.
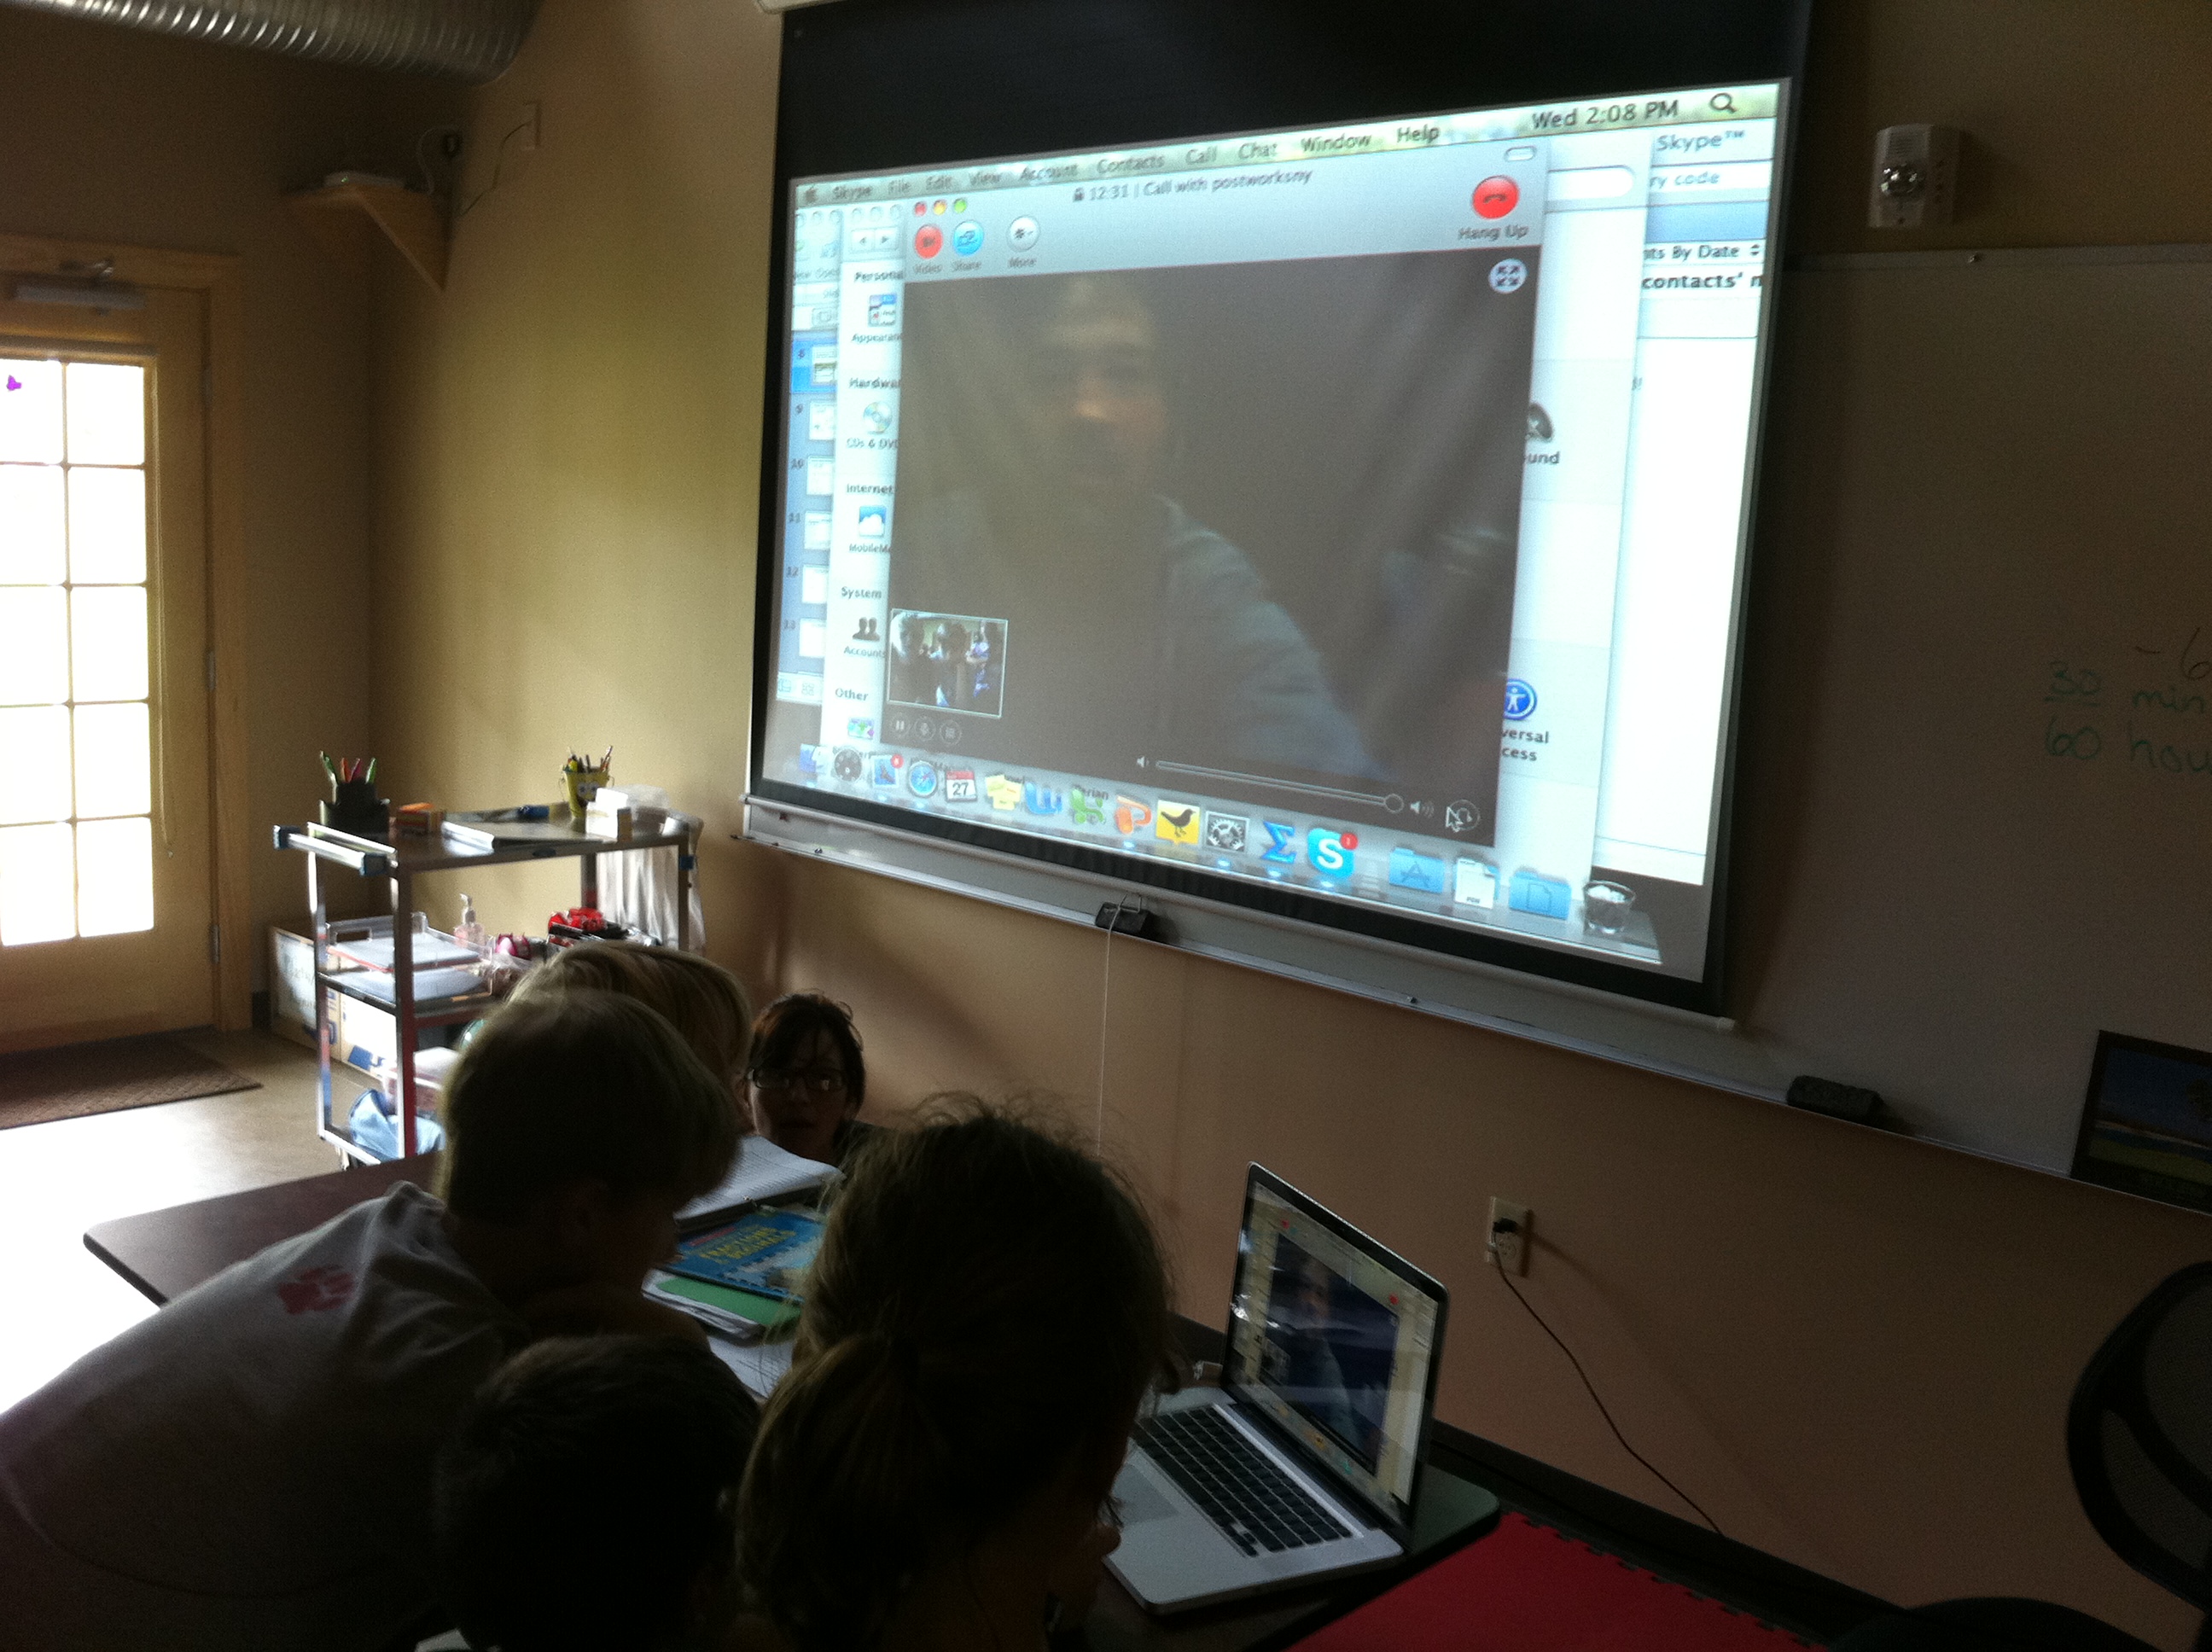
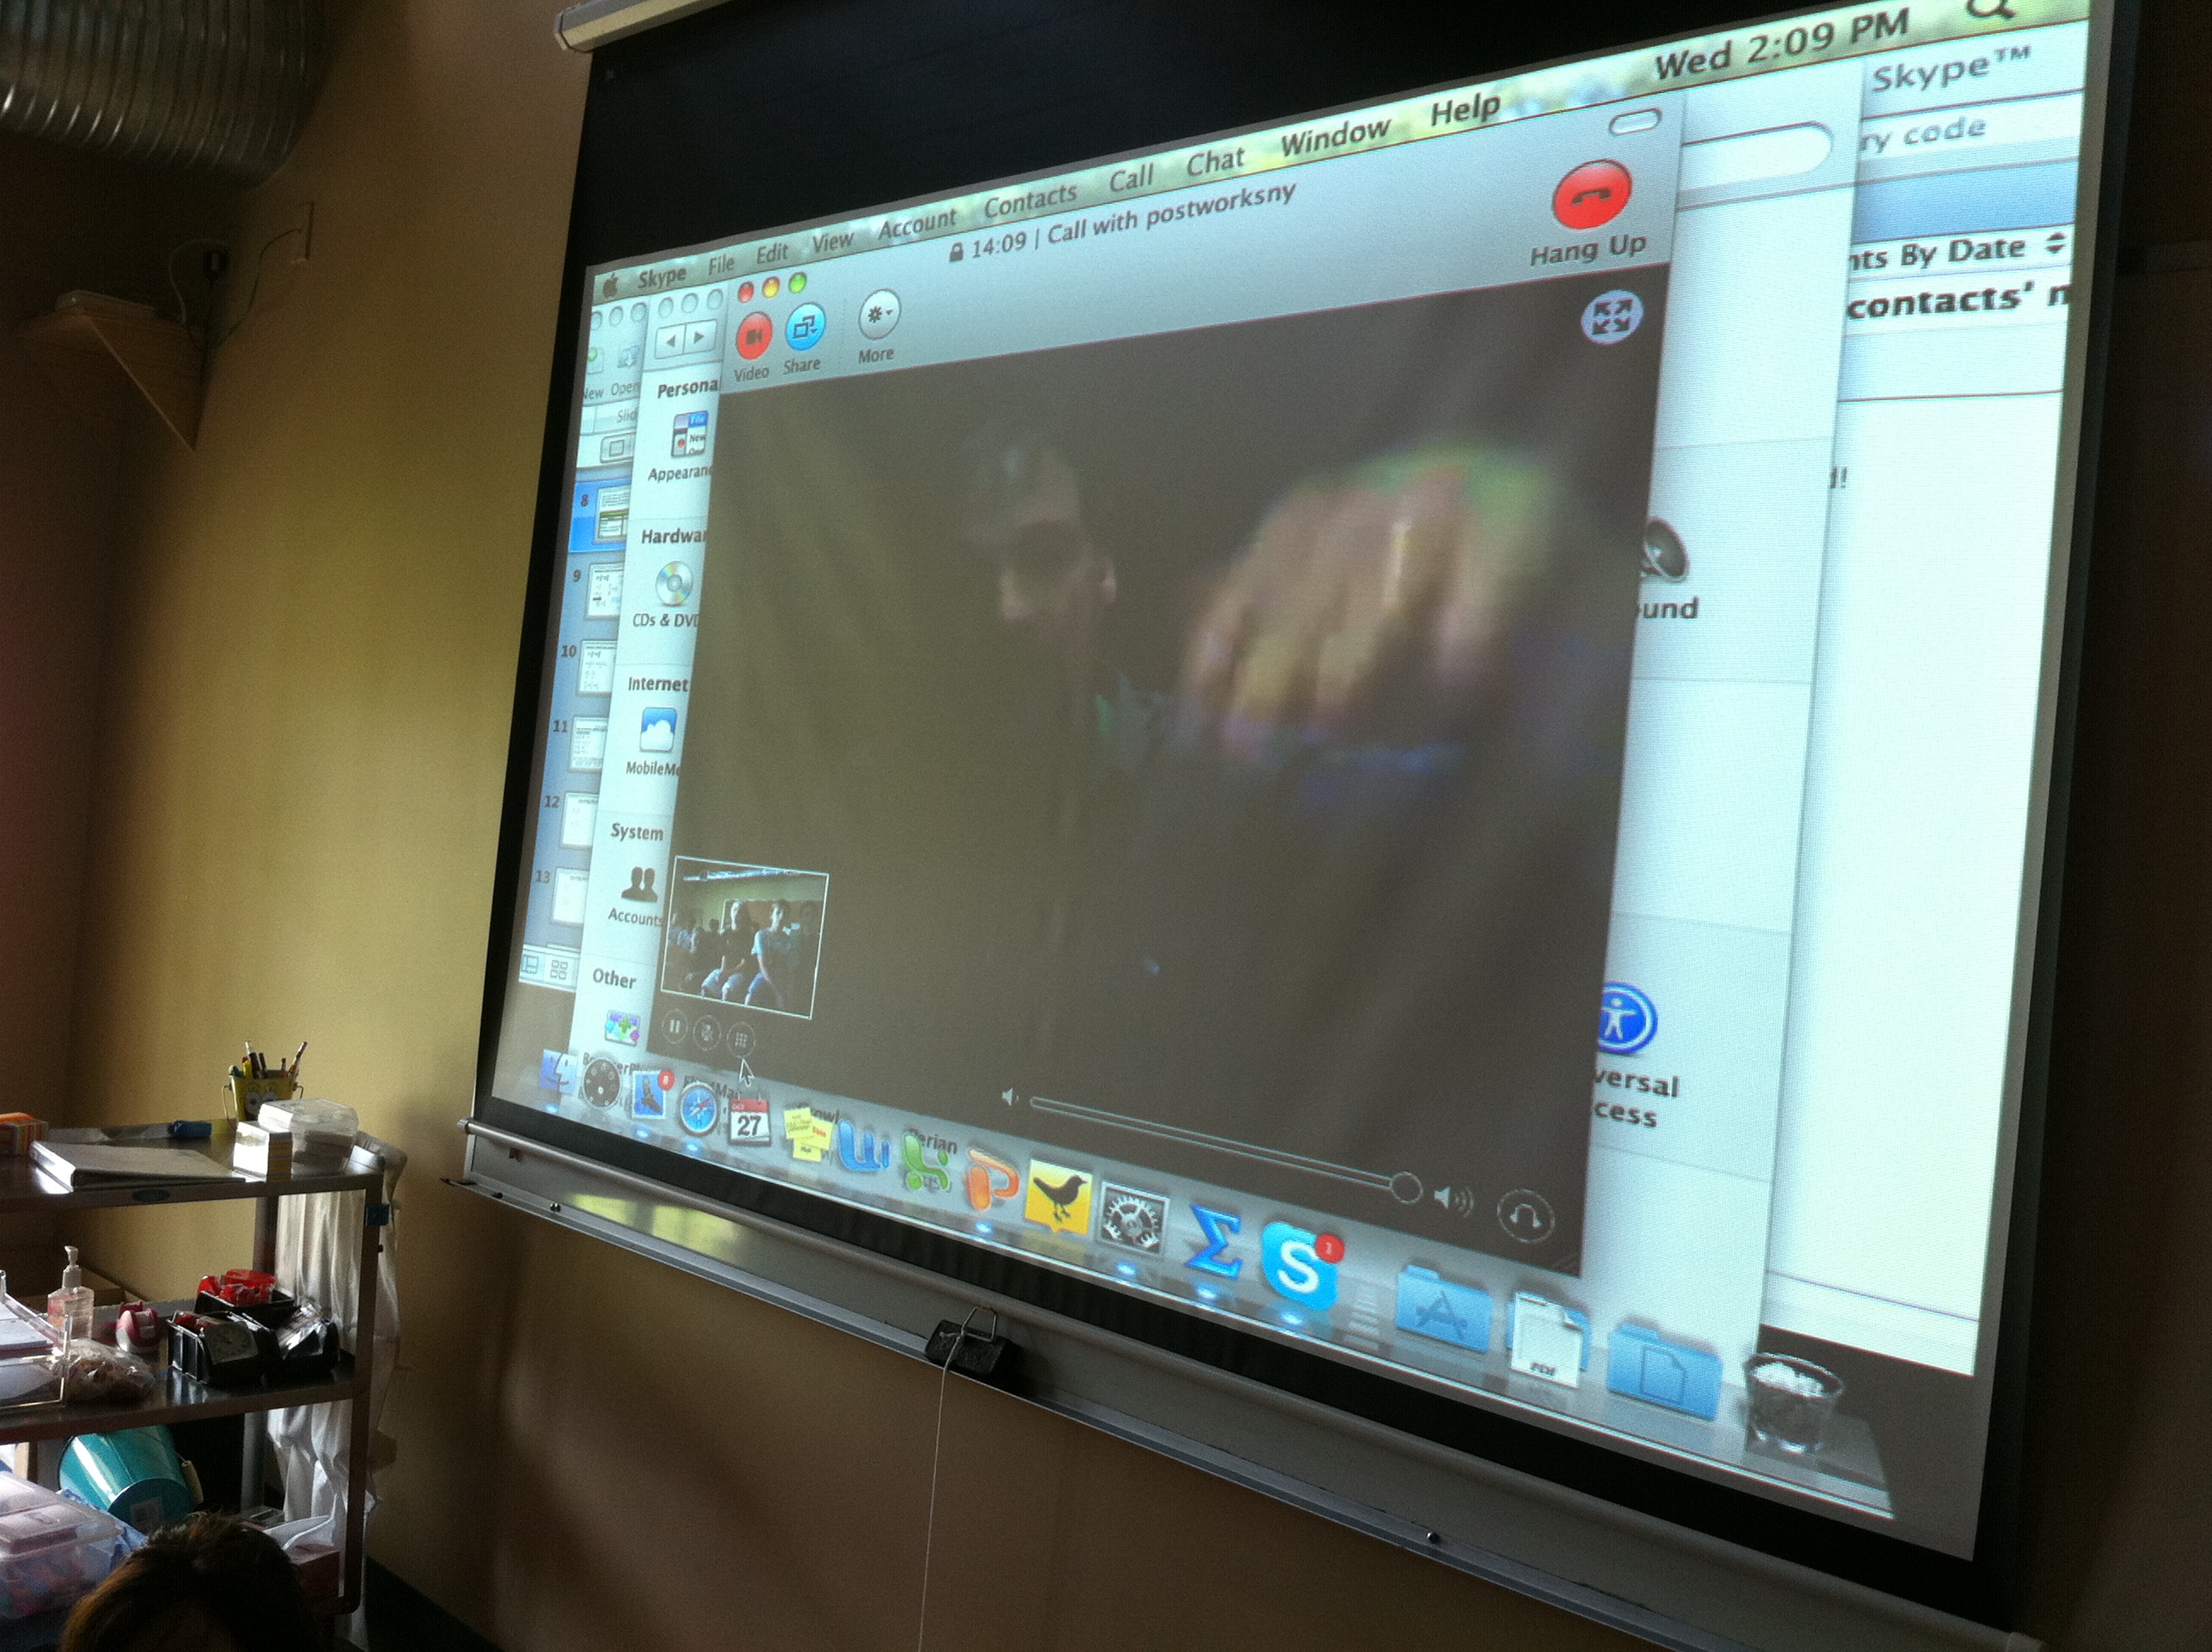
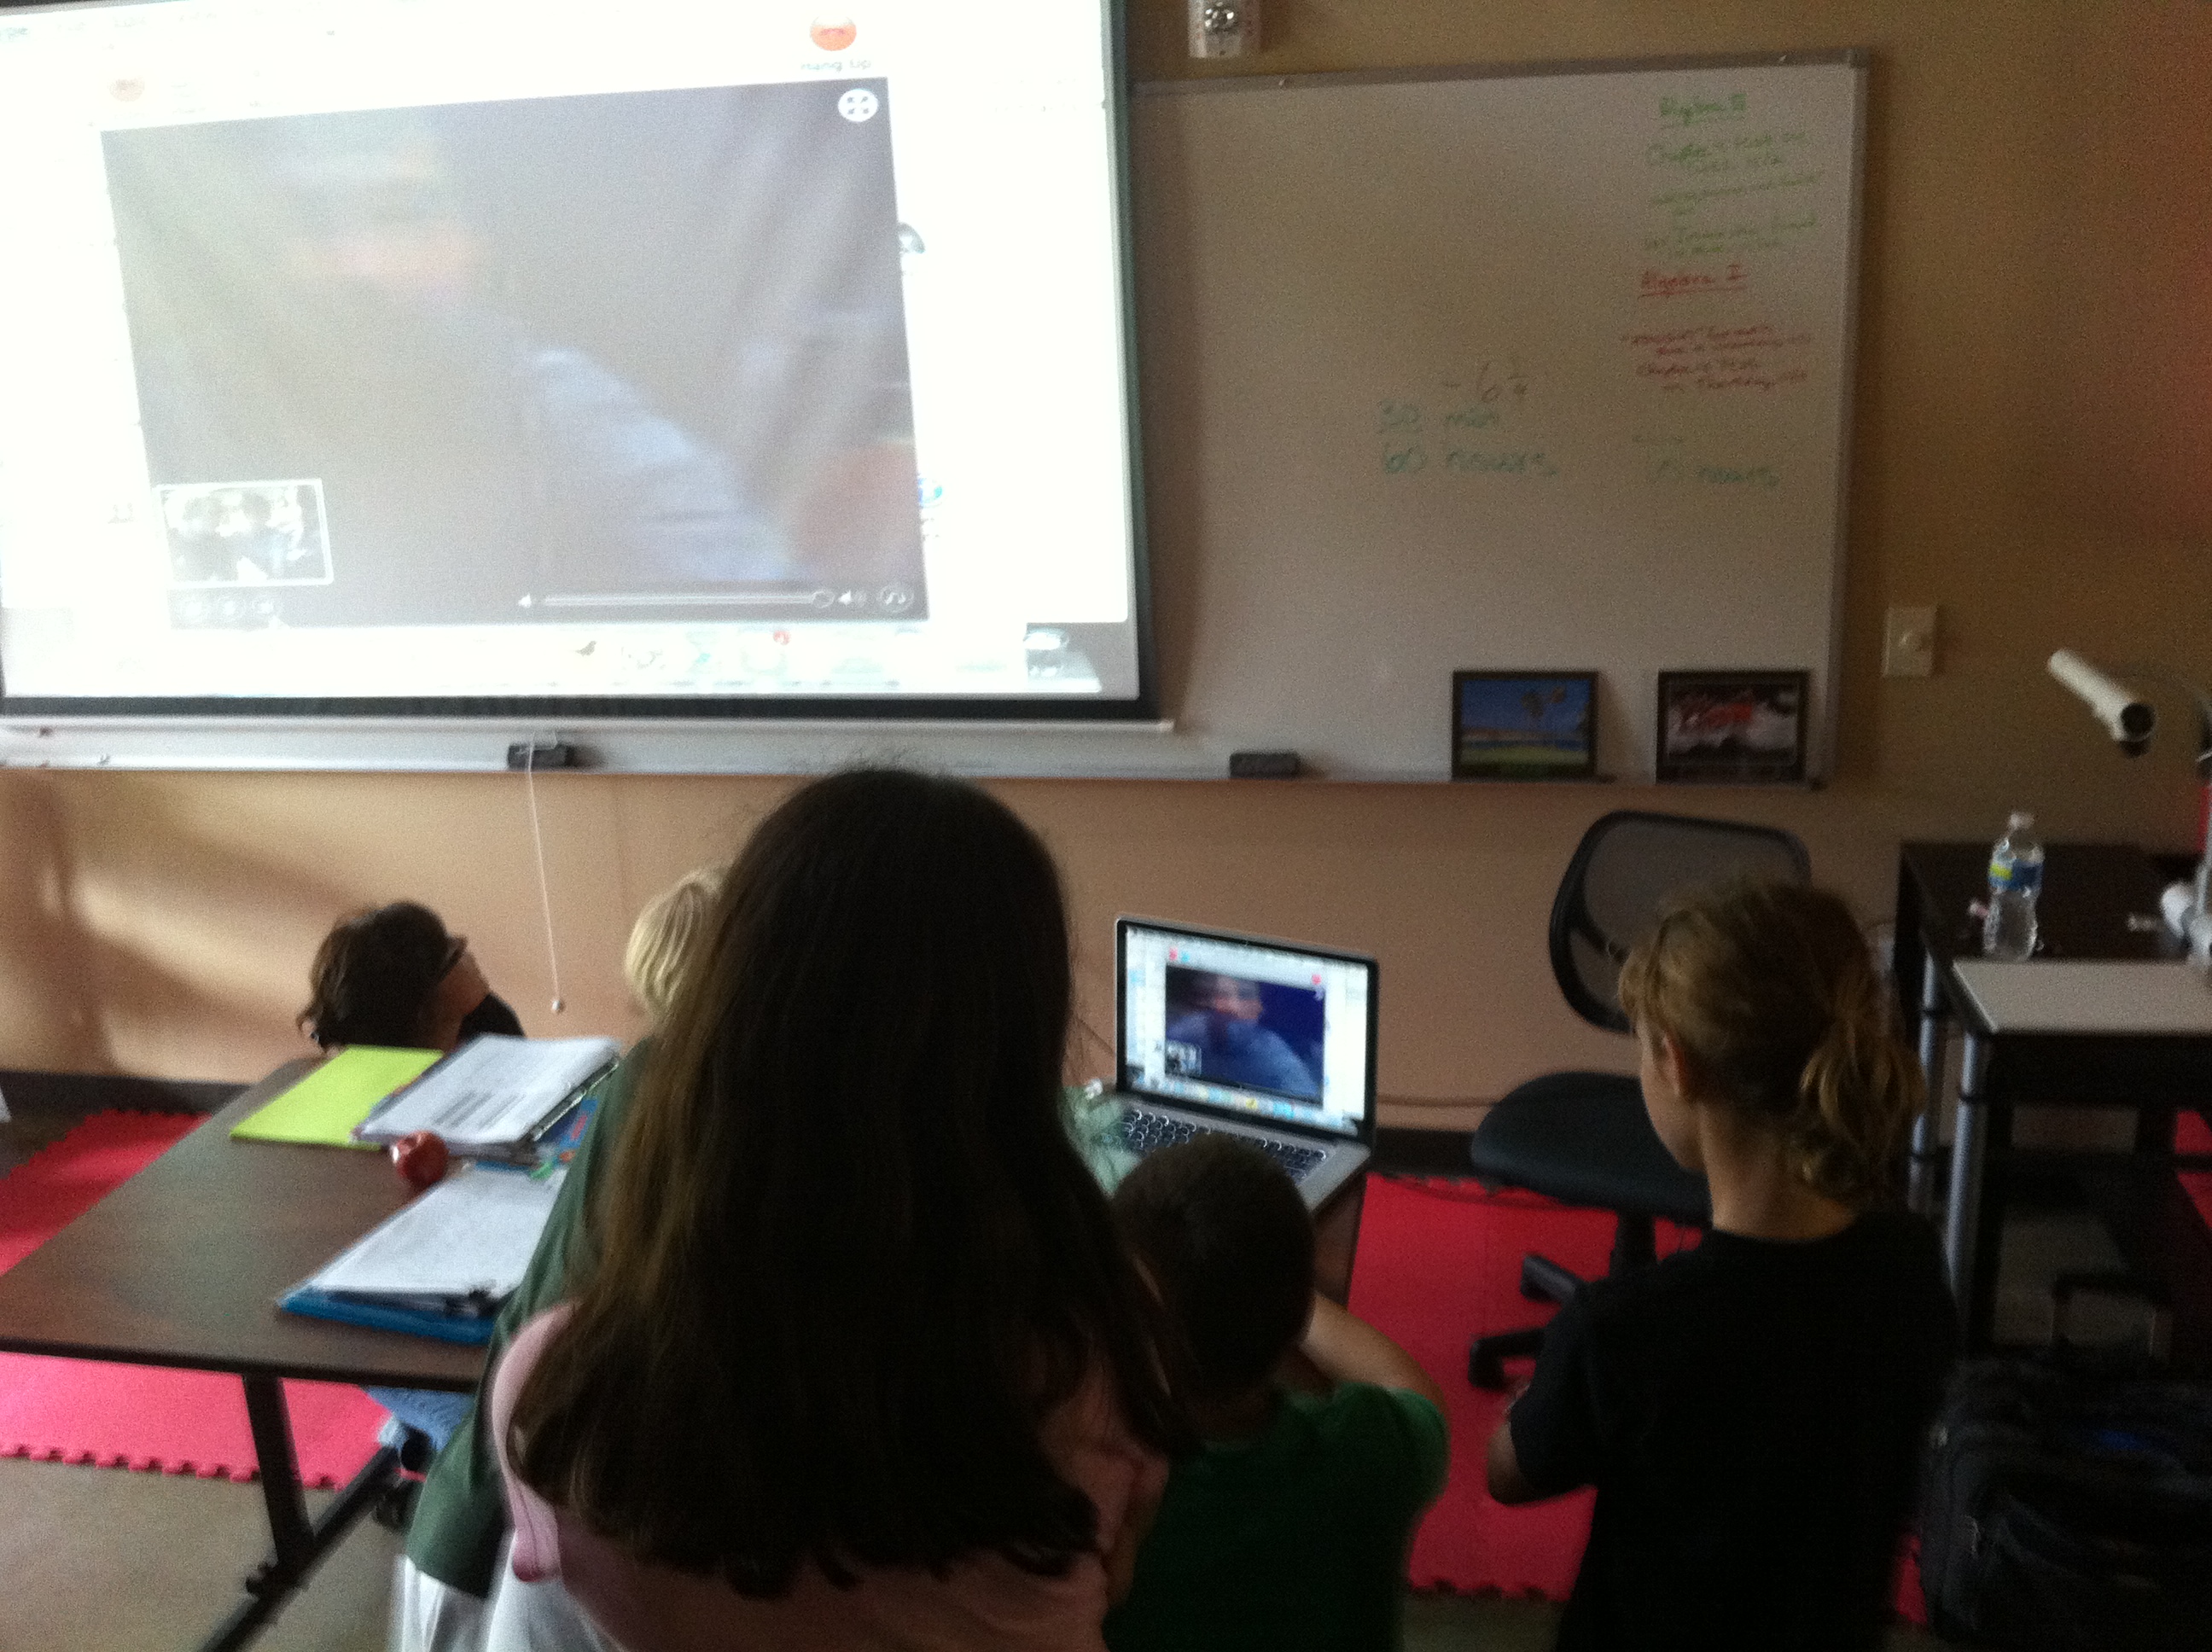
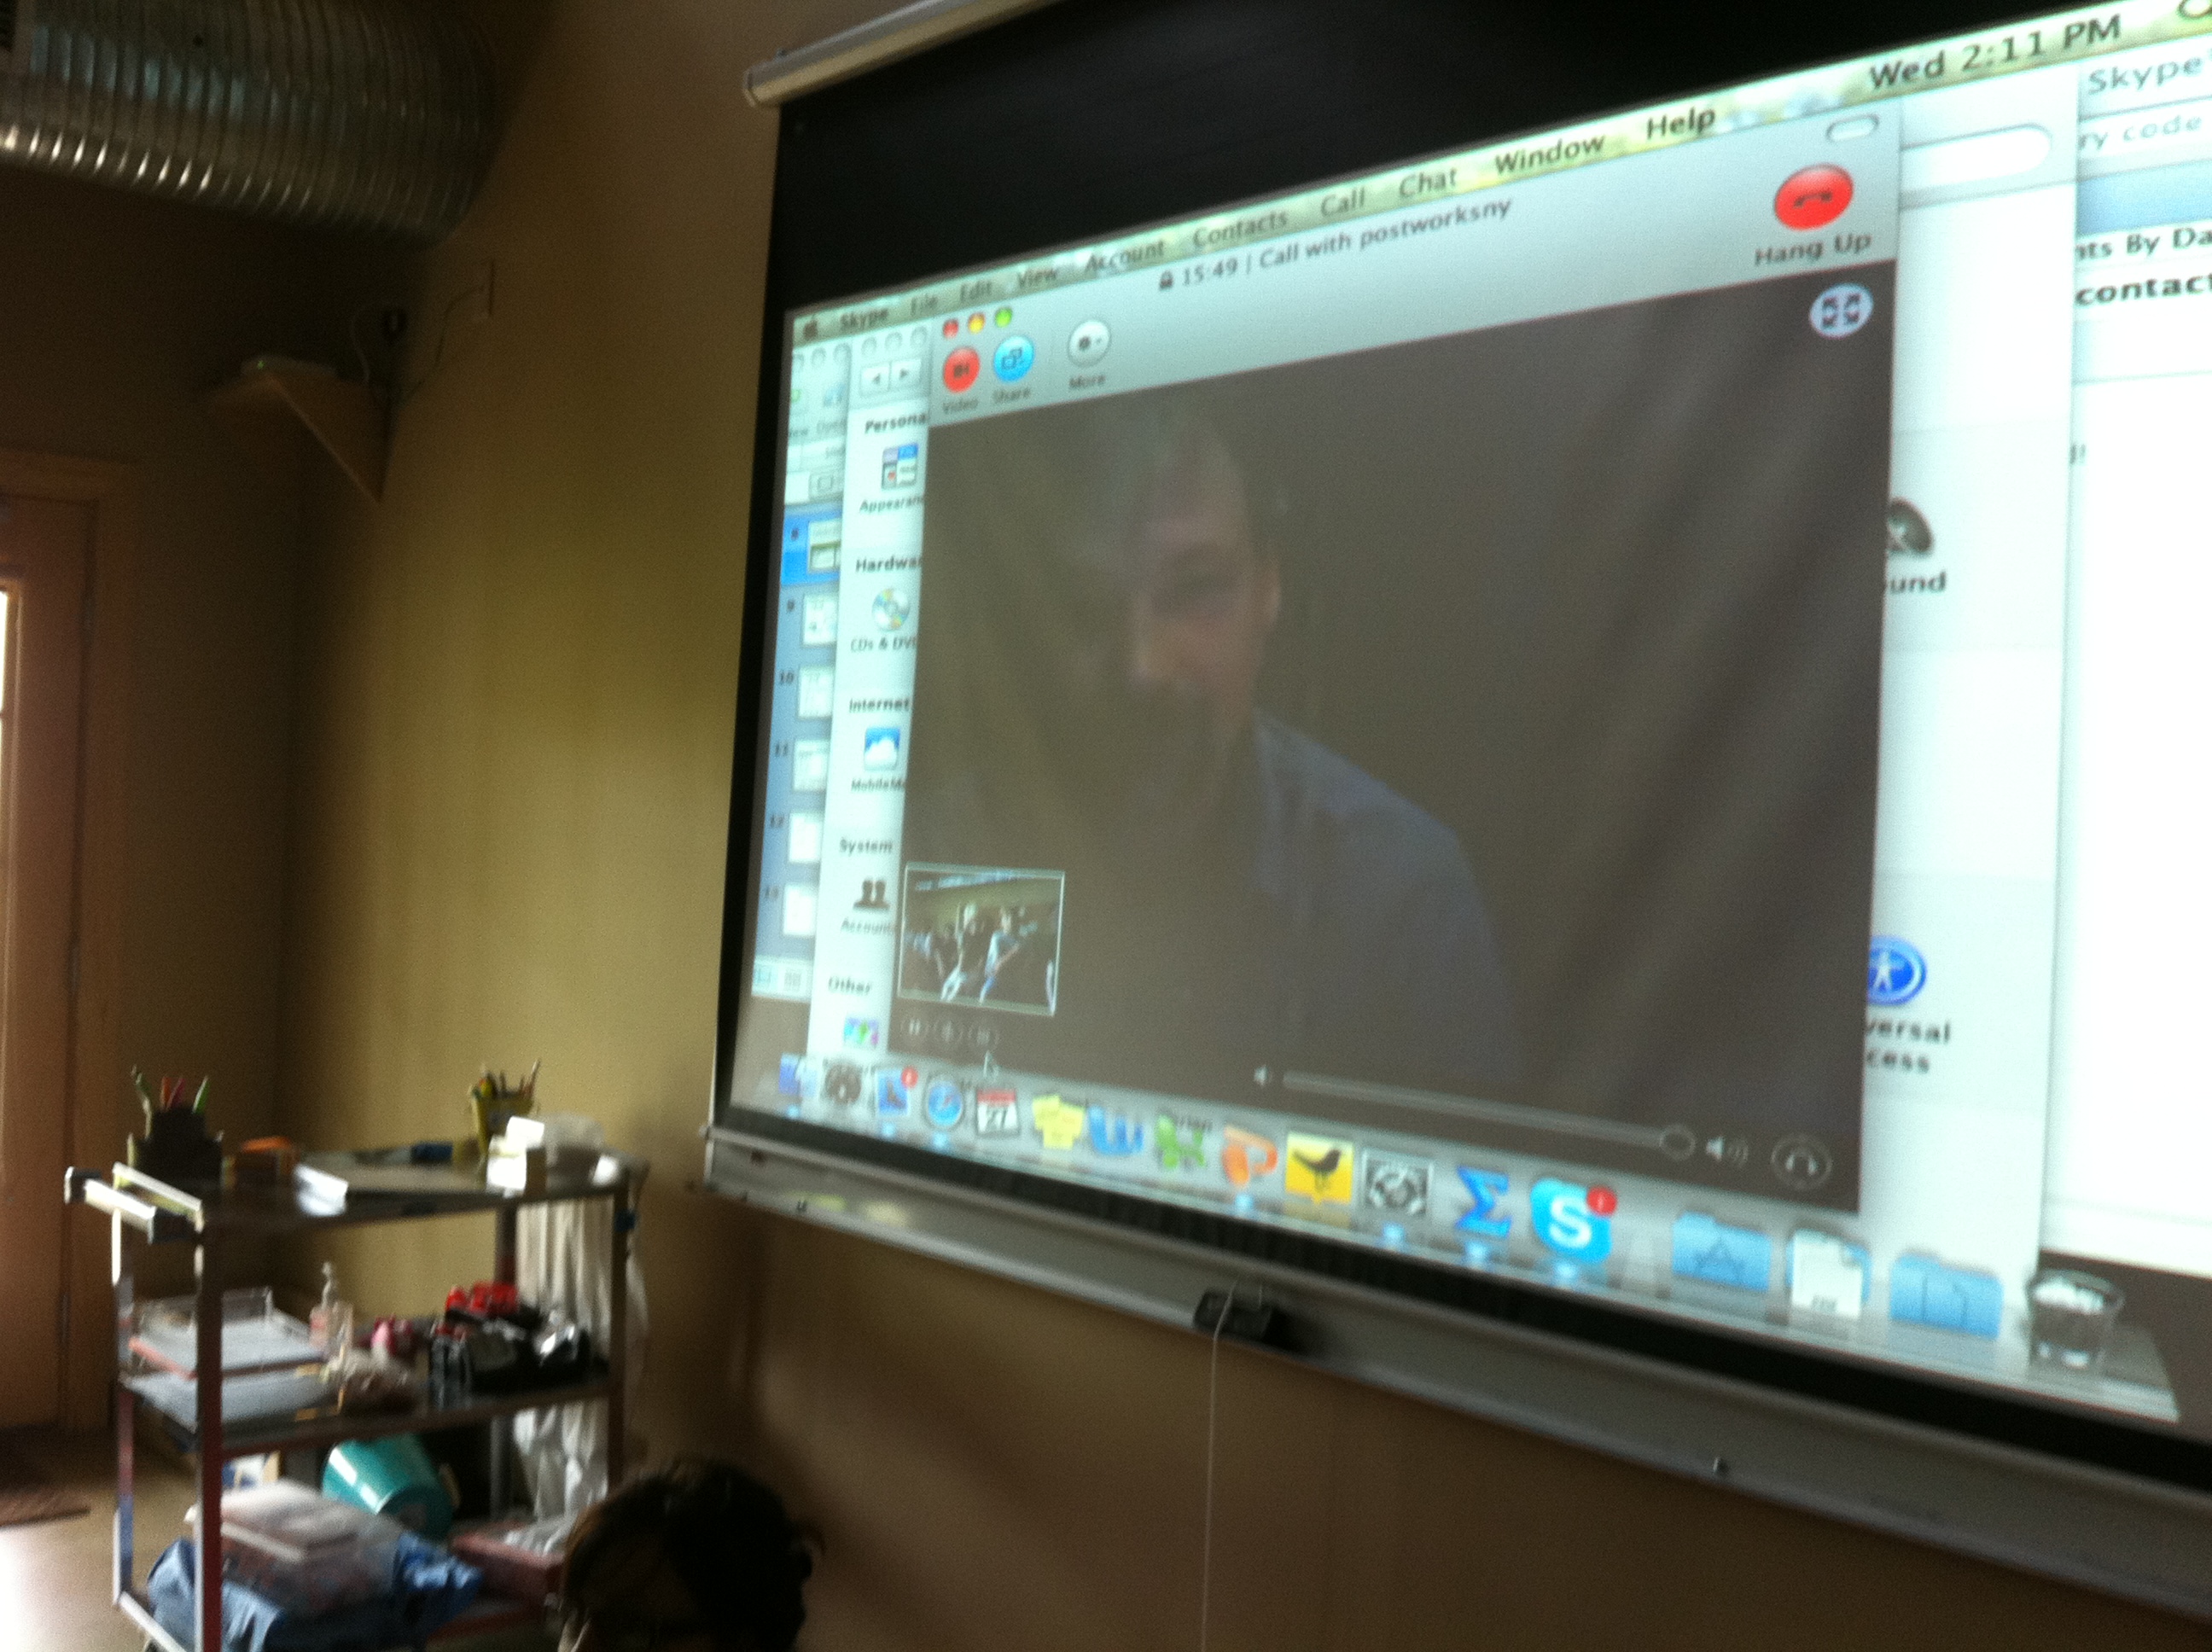
Each group collaborated before the interview and came up with the questions they wanted to ask him. The students came up with some fabulous questions and I was impressed by their professionalism. It is so hard to believe that they are only 12 and 13 years old sometimes. They are an amazing group of students! Some of the questions the groups asked about were camera angles, panning, zooming and the amount of hours it took to film a 30 minute episode (the answer is 60 hours!). Thanks Matt for the math lead there – we are going to find that rate tomorrow in class and see how their filming hours and finished film time compare to 30Rock.
When they were finished asking their group questions we had a couple more minutes so Matt gave them more great tips about filming. Then, I let them ask their fun questions. They were most interested in the number of re-takes Matt had to take (especially of Tracy Jordan)! At the end, they thanked Matt and then all at once said, “Who Dat Ninja?”. That gave Matt a laugh. My students had obviously been planning that one. ; )
Click here to watch a video segment of our Skype call!
The video is on YouTube now but will be embedded once Zamzar is finished converting it!
Tomorrow the art teacher is going to have the students chose two of Matt’s suggestions to incorporate into their film. It should be another exciting day!
** All links I refer to are listed at the end. **
On Friday I did an integration unit with social studies. They are studying Japan and population density. We got wifi in our building late Wednesday night, so I decided it was time to “break out” the laptops on Friday!
I used a fabulous lesson that I found on NCTM Illuminations called “Five’s A Crowd”. It was a great activity so I only had to modify it slightly. It covered population density, ratios, and even estimation! And, it had a game element so it was very fun! I used their grid worksheet but modified their game sheet. Of course it was my first time doing anything like this so we had some bumps in the road, but next year it will be so much better!
1) First the students distributed rice onto grids to visually compare population density of two communities, and to create a definition of population density. The only thing I had at home that was small enough for the grids was arborio rice. So, I used colored paper so the rice would show up better. The kids loved the rice (apparently it was tasty and of course I let them eat it after the activity was over). But, it was very hard to move around because it was so small. Next year I am going to enlarge the grids and use a small dried bean – like black beans.
2) Then we talked about the density of the United States. We wrote down the exact population and area of the US and then I had them estimate the population density without using a calculator using the definition that we found in number 1.
3) Next, I gave them the “game sheets” and they had 5 minutes to try to estimate the 5 densest countries in the world using lists I had compiled and put on the wiki.
**Big Bumps Here:
4) When I finally made them stop (and they didn’t want to), we were seriously running out of time. So, even though I had planned to have them enter all five countries into a Google Document spreadsheet that I had created, I only asked them to enter their MOST dense country. They were to enter their country, their exact data, and their estimate. Then, I had a column that calculated the exact density so we could see how close their estimate was. Then, I was going to sort their list and pull in the top 20 most densely populated countries to see how good their estimates were.
This is when my lesson went HAYWIRE.
First of all, I didn’t even know if the Google Docs were going to work. I didn’t want to spend time having students sign up for accounts or sign-in so I made my document editable by everyone. If they couldn’t enter the info, we would have skipped this part. But, voila! It worked!!
Since I didn’t know if it was going to work, and this was our first time using it (including MY first time), I did NOT prepare them for what would happen. And to be honest, I didn’t even anticipate the snafu’s that we would encounter. The kids were simply AMAZED that what they entered showed up on the projector and everyone else’s computer. They had never seen or used this sort of interactivity. They were very new at this and very excited, and this caused several problems:
With all of the craziness that ensued I barely got to throw up all of the amazing population density graphs I had found AND play with the SORTABLE wikipedia population density by country data that I found. I would have liked to spend so much more time on this stuff!
Overall, though I still think the lesson was a smashing success because it was interesting, fun, and even exciting! It was very enriching to add real life statistics and integrate their current social studies lessons into pre-algebra! I NOW know what to expect when using Google Docs with a whole class of students at once and can prepare them, in advance! ALL of these snafu’s were completely my fault and could have been easily prevented with proper instruction on HOW to use Google Docs to the students. Too bad for me I just didn’t know those instructions in advance. But, I think that we all learn best by doing it ourselves and I learned so much from this lesson!
I can’t wait to use Google Docs again in the future!
LINKS:
