
Yikes. So the title is dreadful. I need to work on that now that I will share my HS lessons! Also, I only took two pictures of the action and they aren’t great. As soon as I pulled out my phone, a student asked me, “Is this for your blog?”. And then the subsequent comments were either, “Please don’t take my picture.” or “Please, take MY picture!”, and then posing for me. So, this threw me a bit. I don’t care if they know, as all my MS students at my last school knew (and begged me daily to take their pictures and blog about it). I just wasn’t expecting it yet. Again, it’s hard being new.

First of all, I needed an entire 90 minute block period for this activity. So, if you do not have a block period, I would set aside two days. However, this activity is worth the investment! I am using the book Discovering Advanced Algebra for my class, and this one activity covers decaying geometric sequences, decaying shifted geometric sequences with limits, and graphs of geometric sequences.
I got the idea from Sarah (thank you Sarah!) but needed to alter it because I wanted to define the function recursively, and I wanted to include limits. I did not tackle growth, as I plan on teaching that through finances next week, so I only covered decay.
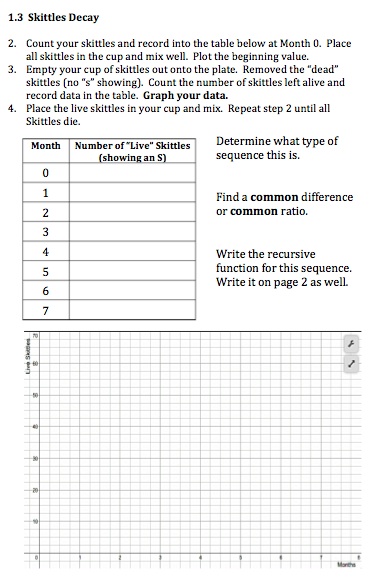
Experiment 1 – Decaying Sequence:
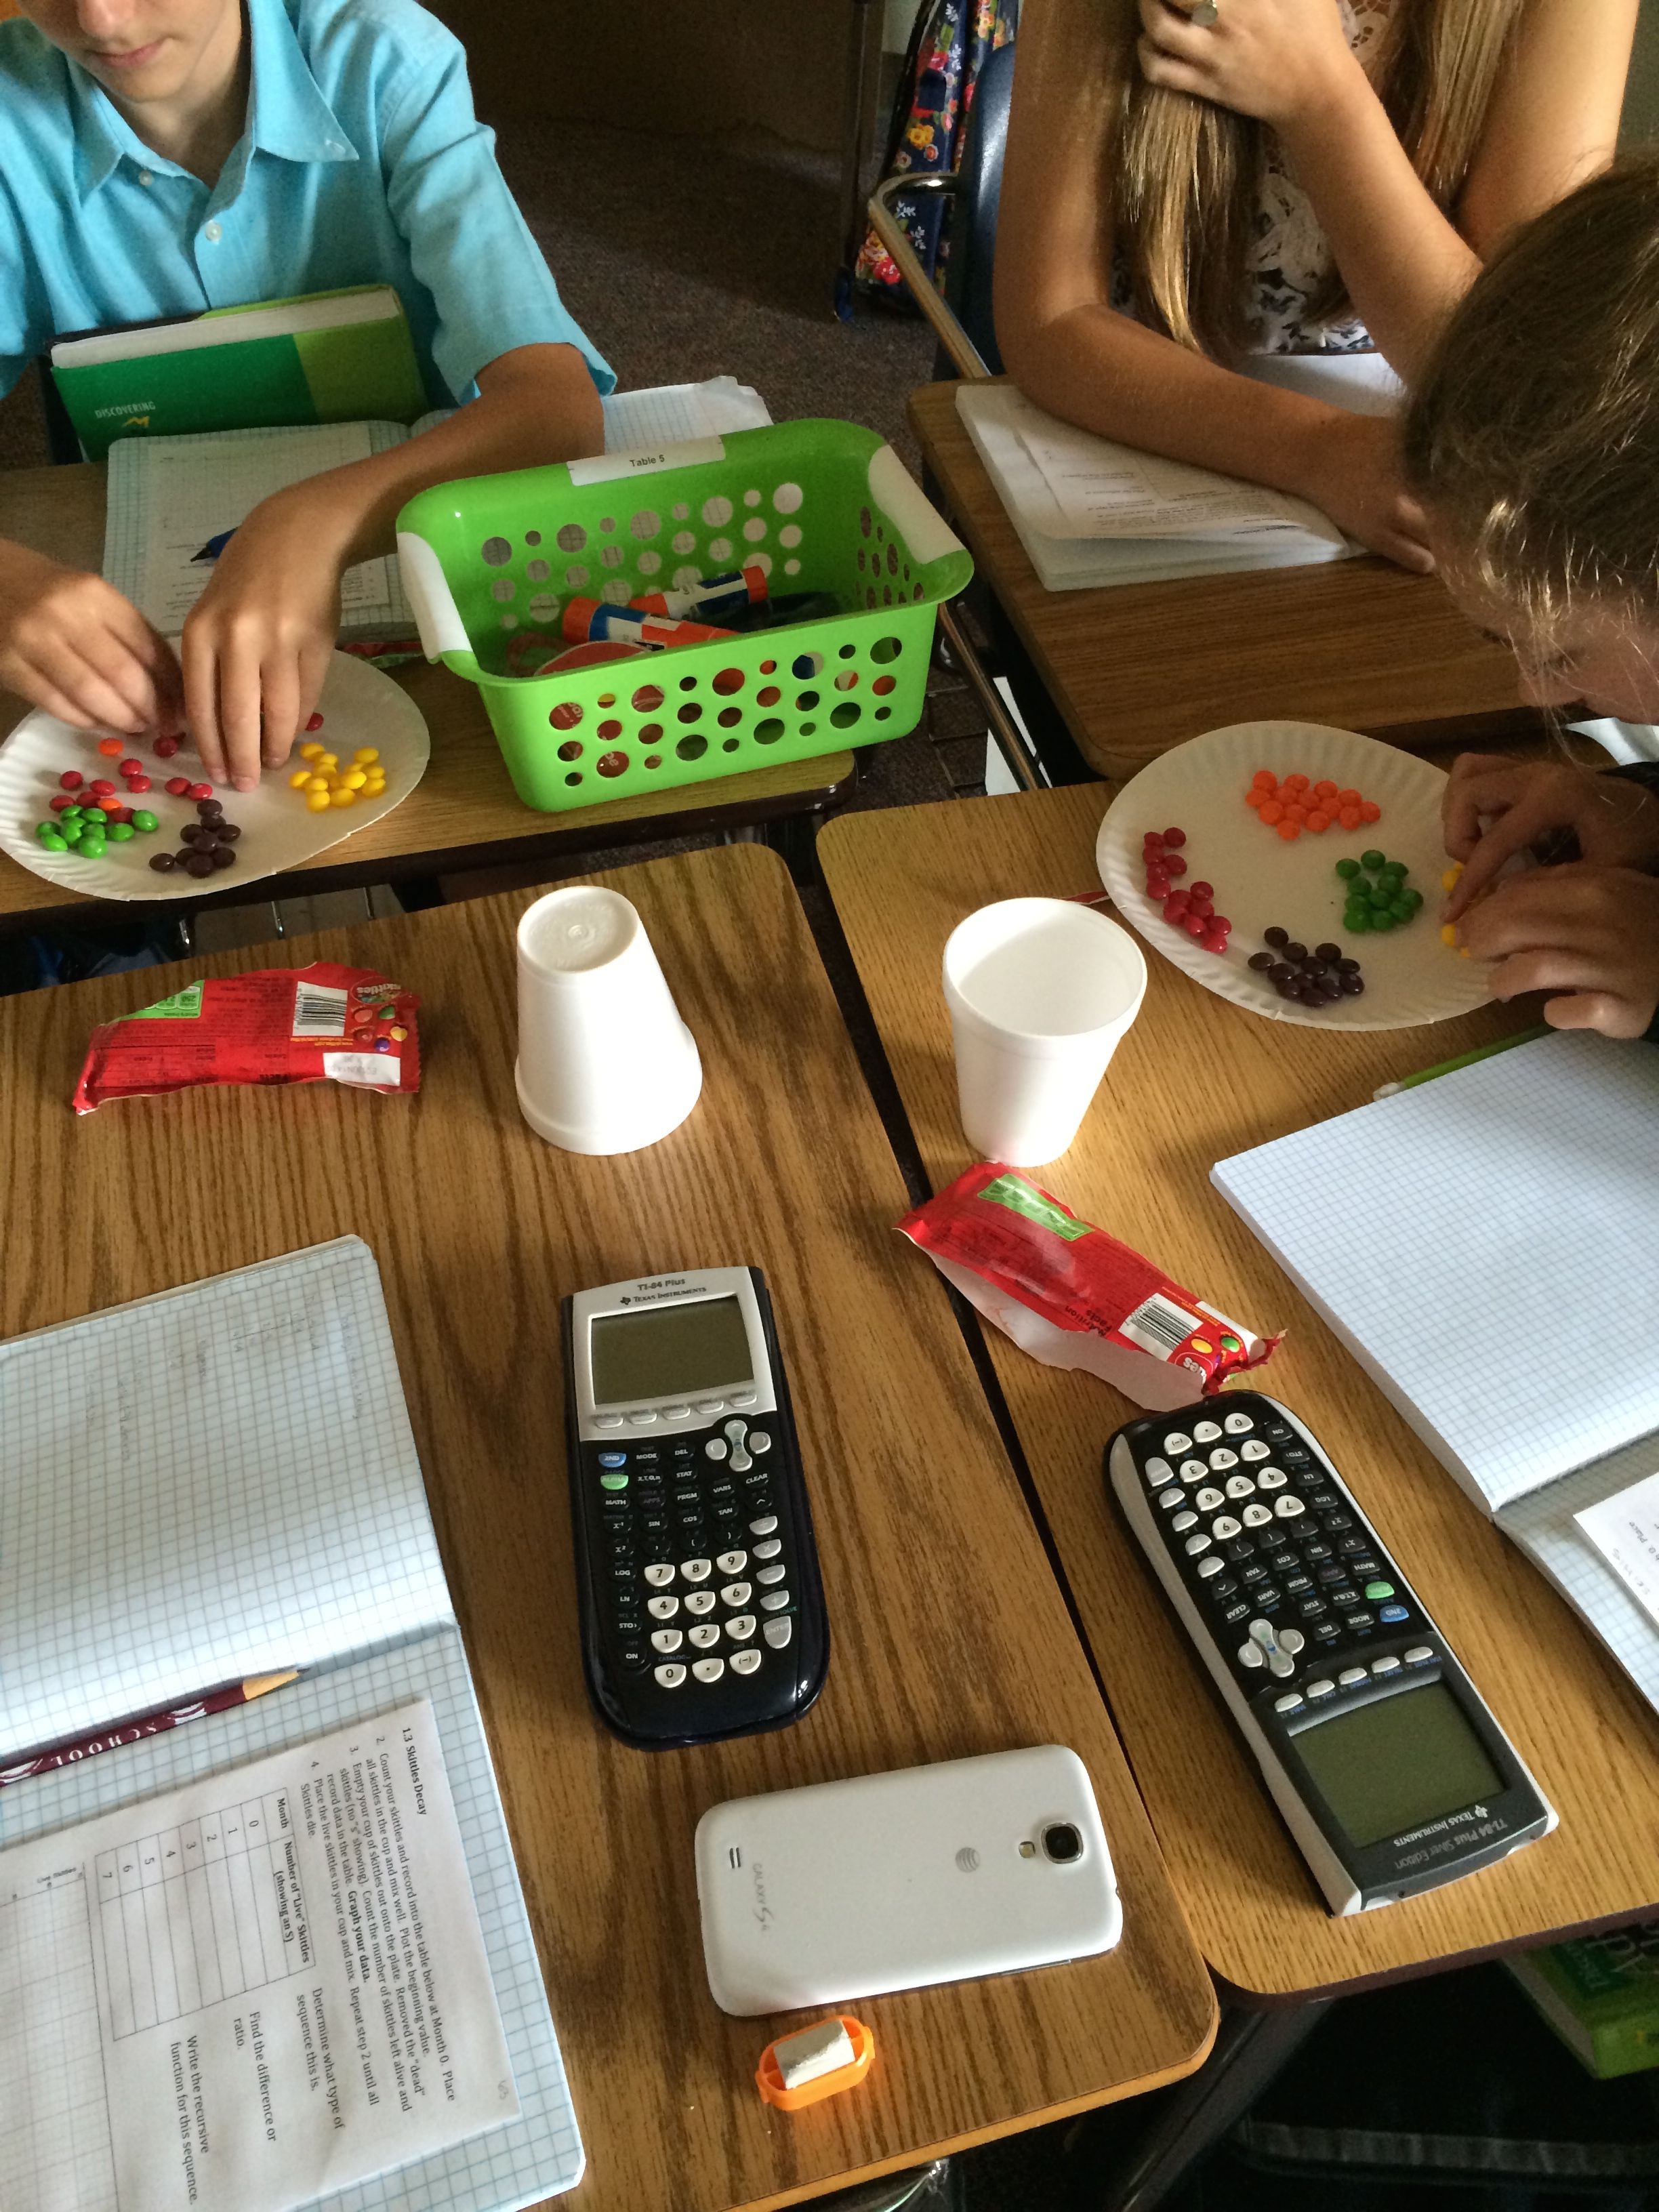
I gave each pair of students a package of Skittles, a plate, and a cup. Most of the work we had done the previous day was with patterns that started at step 1, so I wanted to start with an existing value. This is a good precursor for financial functions as well. Thus, I had them count, record, and graph their initial Skittle population before we started “killing them off”. They then put them in a cup, shook them up, and spilled them out on the plate. We recorded the Skittles that had an S on them as “Live Skittles) and put the dead aside. I had them count even Skittles with a partial S and told the kids, “They aren’t dead yet! They are still hanging on! They are only partially dead!” You must be very clear about how to pour out and count the Skittles. I do not have a document camera this year to show everyone what to do. I had a couple of groups doing wacky things, like trying to rub the S off of the Skittles (in effect, actually killing them), counting only Skittles that were blank on both sides, or taking out the Skittles one by one instead of just dumping and counting. As they repeated the procedure they recorded everything in a table and graphed each point. ** Note to next year self: Remind them to graph as they go along. ** We talked about the percentage of Skittles that were dying each time. They noticed that it was a geometric sequence and that the ratio of each term was similar. At this point, we talked about how to find a ratio that could best represent the experiment for any stage and averaged all of the ratios. After each group found their common ratio, I had each group tell me their common ratio. I wrote them all on the board and we found the common ratio for the entire class. I should have emphasized that we needed ONE “common” ratio in order to define the function. Again, next year. Last, we defined the Skittle death sequence for the entire class.
Experiment 2 – Decaying Sequence with a Limit
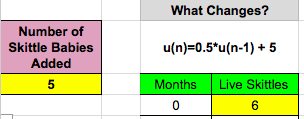
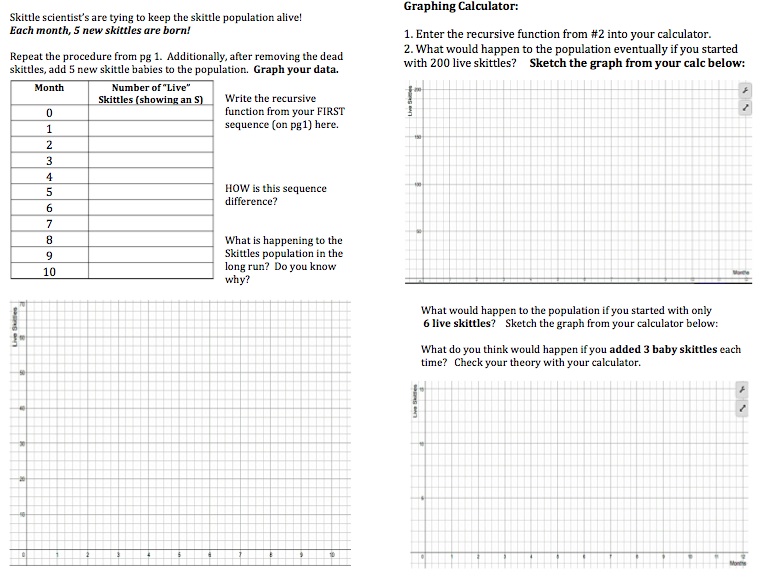
Once they defined their sequence, we started again. But this time, we ADDED five Skittle babies every time we killed a bunch off. I put WAY too many trials in this section and have shorted it for you. However, the frustration did prove for some much needed teacher entertainment. “Why won’t they all just DIE already?”, “WHEN are they all going to die?”, and finally, “Oh my gosh, they are NEVER all going to die, ARE THEY Mrs. Reulbach?!?” The Skittle population wasn’t the only thing that had reached it’s limit! But we forged on and added our +5 to the function.
Graphing Calculator Investigation – Changing the initial number of Skittles.
I totally ran out of time for this stage because I had no idea it would take so long to kill, record, and graph Skittles. I had started class off with an additional activity before I started with the Skittles. (It was my FIRST block period ever and 90 minutes seemed like an eternity – especially if we finished early! I have so much to learn.) I asked them what would happen if we started with 200 Skittles. I was pleasantly surprised that many students actually knew. But, I acted like I didn’t believe them and made them enter their brand new shifted geometric sequence into their graphing calculators to prove it to me anyway. The next step was to change the initial Skittle population to only SIX skittles and then watch the graph shift magically before their eyes. But it was 3:00 and we were all at our limit. So I will pick up here on Monday. The last question asks what will happen if we change the number of skittle babies added each year so they can see what makes the limit actually change.
They were really annoyed that the Skittles didn’t die in the second experiment AND it was the last block period after two days of block periods, on Friday no less. So, I have no idea if they even liked this activity. I don’t care if they loved it as long as they didn’t hate it and as long as they learned from it. But since it’s the first week of school and I am totally new to HS students I have zero idea at this point. I guess only time will tell!
Any thoughts and/or improvements would be extremely appreciated. Love, the Newbie.
Important Notes:
- This takes the entire block period.
- SHOW them how to dump and count Live Skittles. Do not put dead Skittles back into the cup. Or, give them two cups!
- Remind them to graph as they go along.
- Emphasize that we need ONE “common” ratio in order to best define the function.
The Doc and PDF files are on Box here. They are in landscape booklet style so students can fold it and tape it into their notebooks.

This sounds like fun! I may try to adapt this for Algebra I later this year.
The moment where kids realize that the +5 version doesn’t tend to 0 sounds especially powerful. Love those moments!
I like this a lot.
What you have here is the electric motor in disguise!!
Animal/insect populations can be described like this, but it gets a bit more complicated when some other animal is eating them.
Regarding the title, “Recursively defined sequences” used to be called “Recurrence relationships”, (distant past, maybe).
And now “patterns and structure” (SMP)
Starting with a(n+1) = 0.5a(n) +5, rewrite as a(n+1) = 0.5a(n) + 0.5 x 10
which in this case is the simple average of previous value and steady state value.
It is more interesting when the decay rate coefficient is not 0.5, so consider 0.8
The steady state is now 50 and we can see the equation as
a(n+1) = 0.8a(n) + 0.2 x 50
which shows next value as a weighted average of previous value and steady state value.
There’s more!
Starting with the skittles again, a(n+1) = 0.5a(n) +5, rewrite as
a(n+1) – a(n) = 5 – 0.5a(n)
which shows the change from one time point to the next.
This seems to me to be one of the things meant by “Make use of structure” and “Look for patterns”. Also it gives the students a feel for what can be achieved by algebra.
And when you get to statistics check out “Exponentially weighted moving averages”.
The math is identical.
Awesome! Thanks so much! I will def use that when we get there. Our book starts w recursive and then moves to explicit later. I really like this style as I think it will help them explicitly define the functions.
Neato!
I know you have other aims, but if you want that first one to go a little faster, you could add the concept of half-life, which is a time-thing. I have my chemistry classes pour out the candies every two minutes ( which means they need to count really quickly at first, and the last few half-lives seem to take forever).
geometrical example:
Spirals, best with polar graph paper, here http://howardat58.files.wordpress.com/2014/08/polar-graph-paper-jpeg.jpg
radius(n+1) = 1.1 x radius(n) \where n is the index for the angle measure
angle(n) = n*base angle
use the base angle from the paper, and start with the smallest circle for radius(0)
Pingback: Task Propensity: Beyond Desmos | Five Twelve Thirteen