
Calling all teachers to help me make these better!
 This summer at Twitter Math Camp, Glenn (@gwaddellnvhs) and Jonathan (@rawrdimus) showed us how they lead students through all of the functions in Algebra 2. Basically, they put all of the equations into (h,k) form. Fortunately, the book I am using this year, “Discovering Advanced Algebra” does basically the same thing. Since it is a “discovery” book, they have some good ideas that I have been able to modify and made into INB (Interactive Notebook) form. Never fear, this just means it’s a worksheet that you fold in half.
 The first discovery was also my students first introduction to graphing with Desmos on their own. Of course they have seen me use Desmos multiple times by now since Desmos has all of those great example graphs in their side bar!
Here is how I progressed through discovery for linears, quadratics, square root, and absolute value. The Box files with the word docs are at the end.
- Horizontal and Vertical Shifts
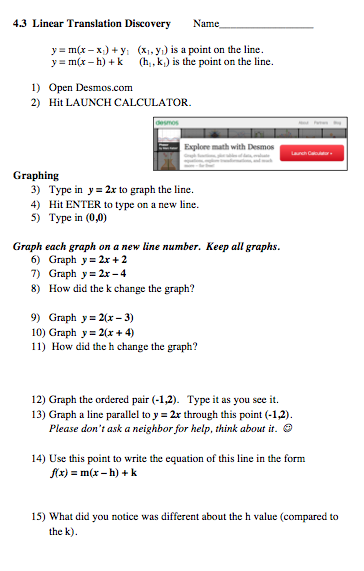
- Linear Equations (first time with Desmos)

- Quadratic Equations

- Reflections with the square root function
- Dilations with the absolute value function – these last two are combined into one. I would love any suggestions on this – before Monday. I know, I’m asking for too much here! 🙂


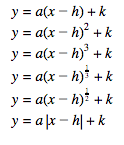
Also included is a “Transformations Parent Graph” foldable that I made to sum it up. I kind of hate this one, and would love suggestions here for sure! Should I add dilations? Why is it so ugly? What else do I need to add? I need help here for sure.

Algebra 2 Function Transformation Discoveries
Please note: I did not make all of these discoveries from “scratch”. I created some of them. But some were inspired by the textbook I am using this year, “Discovering Advanced Algebra” and some were created by my amazing co-teacher. I then adapted all of them for INB (Interactive Notebook) form.

Hi !
I think you have done too much of the thinking for them.
I would have started with y=x^2, not even mentioned the “standard form”, but asked a few questions such as “What if the plot was somewhere else on the grid?”, or showed them some plots of shifted quadratics and asked “How did they get there?”. If this doesn’t move fast I would go for each of the shifts separately, y=x^2 +3, or…-2. Get them to see that the equation is trying to tell them something, like “In this one the y values are all 3 bigger than in the basic one”. And so on. Also “How can I get the plot to move sideways?”. Then is the time to go more formal and develop the h,k parametric version.
Regarding the summary booklet, I would go for examples. If I as a student knew that x^2+3 was 3 units up from x^2 then I would be more accepting of the general form.
I see that you didn’t use the words “translation” or “rigid motion” anywhere. Why not?
Last point What is a Parent function? I have been involved with math for real since age 14 and have Never heard the term. maybe it’s a USA thing.
Try these ideas out on Monday !!! And best wishes.
Thanks for all of the great suggestions. I am trying not to give them too much right now so those are excellent points. I used to say “rigid” vs. “non-rigid” but they never really stuck with the students. I still use the words in class, but usually do not write them on their discoveries. Also, I usually use translations with linears, but them switch to transformations as I move through quadratics. I’m not sure why, or which one is better. Do you have thoughts there? Another thing I really wanted to do was to give them an actual picture of a parabola or other function on Desmos (as you can now insert pictures and share your graphs with them), and then have them try to come up with the equation from using the parent graph. But I ran out of time. First year teaching problems. Oh, and I’m not sure where the term “Parent Graph” came from but I have used it for years. We call all of the transformations, “graph families”. Thanks again for your comments, they are always well thought out and helpful!
My understanding on translation vs. transformation-
translation is only horizontal/vertical slides. Transformations is more general, and encompasses translations, reflections, and dilations.
They are all transformations, just that translations are a special case,
so I would use the term were it applies (in all your examples).
You can see them easily as translations if you view them as a change of
variables, for example X=x+3,Y=y+5. This represents a translation of the
plane sending x to x+3 and y to y+5. The effect on the equation y=x^2 is
found by solving the transformation equations to get x=X-3 and y=Y-5 and
putting these in the y=x^2 equation. So you get Y-5=(X-3)^2, or in your
standard form Y=(X-3)^2+5. This is how the minus sign pops up.
Regarding the use of an actual parabola there are many pics via google
of parabolic arches around the world. Also, satellite receiving dishes
are parabolic.
To fit a curve to a picture you may have to include the stretch/shrink
parameter a as in y=a(x+h)^2+k. The smaller the value of a the flatter
the parabola.
So, since Desmos has sliders, you think it would be better to just give them the general form, with sliders, and have them try to re-create a graph than give them different graphs and try to recognize the pattern?
I agree that you may be giving them too much. Our algebra 2 teachers are doing this now, and are having the students watch desmos, with sliders, to discover the transformations.
Have you used a magnet summary (like a frayer model) before? I can’t attach mine that I used for review in pre-calc this year, but I will try to describe it basically, I think it might work for your summary.
Turn your paper horizontally. Divide the page into fourths, and put a text box in the middle for g(x)=a*f(bx – h) + k. I the four sections write your transformations. You may want to call them vertical translations, horizontal translations, dilations, and reflections, to keep the language parallel to what other courses are doing in CCSS, (if that applies to your state.)
You can let the students put pictures, and explanations in the sections that help them remember what each piece does.
I love that you are including linear! Many times students don’t see lines as having transformations. I love that you are using the “point slope form” with them,so they can see how the structure works.
I can’t open your third lesson. I’d love to help you out and comment, but it doesn’t show up in the link to “box”, and I can’t click the image to enlarge it.
So, maybe just give them a graph and the general equation with sliders and see if they can make it? Maybe several graphs? I love the idea of giving them less. They are used to more direct instruction so even this was a challenge for them at first. Also, I like the linears as well, but the equations can easily be written without transformations so I’d like to think about how to make that better without giving too much away as well.
I have used piece wise in Precalaulus to do that, or since they have had geometry you could transform a ray or segment… My students really liked the idea of only learning one “thing” and applying it to all types of functions. So you could give them a ray, or a line with a point labled, and ask how that line was transformed from the parent line. For example, if the transformed line (or Ray) had a point at (-3,-4), and slope of 2/3, the transformed line would be y=2/3(x+3)-4, transformed from y=x.
I just did something like this Friday with my Precal students (yes, they badly needed the review) and yeah, I agree with the other comments of giving them less (if you have the time!).
I started by giving them the two functions (one at a time!) f(x)=(x+a)^2+b and g(x)=sqrt(x+a)+b letting them play with those sliders. Once they got “what a and b are supposed to do” in their minds, I then gave them the parent function (h(x)=1/x) and asked them to put a and b in there “so it does the same thing to your new function as a and b did to your old function”.
We had studied about a dozen parent functions before this, so they knew what the graphs were supposed to look like. I’m also bad about using the words “translating” and “dilation”… we usually talk about it in terms of “shifting” and “stretching”.
Here’s the post with my old documents to give you an idea. http://wp.me/p2Eyr8-18, sorry for them being in “Geogebra form”, but it gives you the idea.
(This was the first year that I exclusively used Desmos instead of Geogebra, and it was awesome!)
Last year I created this exploration with my Algebra 2 kids.
http://1drv.ms/1uplOou
I had the kids use Desmos. I will tweak it a bit this year, but I am not sure how. We are about a week off. Thanks for sharing your material!
Pingback: A Sunday Summary–Writing SLOs and more… | Reflections in the Plane
I think I am replying to your reply “So, since Desmos has sliders, you think it would be better to just give them the general form, with sliders, and have them try to re-create a graph than give them different graphs and try to recognize the pattern? “.
I assume that they are familiar with the spread out polynomial form
y=ax^2+bx+c
This is the one I would use to play with a parabola until it matches the curve in a picture. So you can use sliders for a, b and c. When they get close enough then you can ask them to convert the equation into the a(x+h)^2 +k form, by inspection, based on what they have done already, and algebraically for the more daring. This should milk the cow thoroughly.
Julie – I did the transformations discovery VERY unstructured-ly. On Thursday, we reviewed basic graphing of parabolas, so on Friday, I asked “How does the graph of the parabola move around the coordinate plane?” I gave the students a list of questions to think about, suggested they use vertex form rather than standard, and gave out iPads. They figured just about everything out, although the wider/narrower versus horizontal/vertical stretch was still unclear by the end of the period. I want to recap on Monday and do some practice, and may borrow your “Life is Good” worksheet as a warm-up. My question to you is did you have the students save any of their graphs on Desmos so you could look at them, or did you have them graph them all by hand? Thanks – WM