
This post is written Taylor Gibson, who teaches at the North Carolina School of Science and Mathematics. Taylor has been using standards based grading (SBG) in his classroom for several years, and shares his SBG system with other teachers every year at the Teaching Contemporary Mathematics (TCM) conference held by his school.
Two years ago, I attended TCM and heard Taylor Gibson talk about how he has implemented SBG into his classroom. I had been curious about SBG for years, and even did a blended SBG model in my middle school classes at my previous school. Hearing Taylor explain it so clearly and enthusiastically was inspiring. When Julia Finneyfrock and I decided to try SBG the following year, it was his model that we started with. So, instead of trying to explain his method, I asked Taylor to guest blog for me. Thank you Taylor!
Standards Based Grading – by Taylor Gibson
Standards-Based Grading has dramatically changed the way I use assessment in my classroom over the last few years. Simply put, it allows your assessments to be both for learning and of learning. Instead of assigning points for each problem and determining how many points a student earns for their response, you instead align standards (or learning objectives) to each problem and decide holistically if students have demonstrated mastery in each standard based on their response. I’ve chosen to report mastery on a scale of 0, 1, or 2 with 0 being no mastery demonstrated, 1 representing partial mastery, and 2 representing complete mastery. While numbers are used to report a student’s level of mastery, these are not meant to be totaled to determine a score for each assessment. Instead, a student receives a small cover sheet with a score for each standard, as shown below:

The light white numbers in the scoring column indicate what problem (or parts of a problem) I will look at to make a decision on mastery. Once score, it will look like:
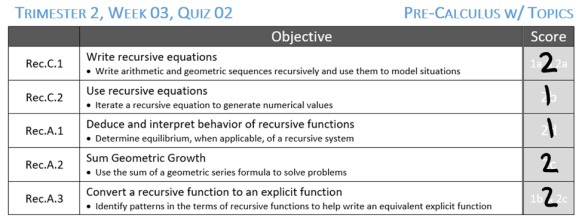
This level of feedback provides students with feedback specific enough for them to look at just the cover sheet and know precisely which topics they need to work on.
This aspect alone of changing your reporting system would be a great help to students. However, the biggest impact for students is that these scores can change over time if they demonstrate a different level of mastery later on in the course. For example, in the include score sheet the student earned a score of 1 on the standard Rec.C.2. Should the student reassess on this standard, either on another in-class assessment or an out of class reassessment, their new score replaces the 1 in the gradebook. Likewise, if a student earns a 1 on the standard Rec.A.3, it would replace the 2 they earned on this assessment. This mechanism results in the following positive outcomes for students:
- Any score earned on an individual assessment doesn’t need to be permanent since students can request a reassessment in the future. I’ve found this greatly reduces student stress and anxiety when taking an assessment. No more tears when a quiz or test isn’t going well!
- It provides an incentive for students to take their feedback from early assessments and seek additional support to remediate their understanding in areas in which they haven’t yet demonstrated mastery (encourages a growth mindset)
- It provides an incentive for students to really learn material, not just cram for a test, since they know that a learning standard may be on a future assessment in a week or two, and that getting a 2 today doesn’t exempt you from having to show mastery again to keep your 2.
At the end of a grading term you can decide how to combine the mastery scores in each standard and convert to a course-ending grade.


Some common methods:
- The % of standards mastered (score of 2) is the grade in the course. For the above example, the student mastered 11 standards out of 12, resulting in a 92% in the course.
- Average the standard scores together and score to a percentage. In this example, eleven scores of 2 and one score of 1 yields an average score of 1.92 or 96% in the course.
- Create your own cut scores for each letter grade based either on number of standards mastered or average score on all standards
Moving to a system like this requires repeated explanation of the system to: students, parents, colleagues, and administrators, but I firmly believe the benefits far outweigh those costs. It’s a complex and nuanced process to get right, but there’s a lot of flexibility for implementation to make it work for your students, classroom, and school.
Taylor was also gracious enough to share the Powerpoint from his presentation, as well as standards in different content areas with us. As in most areas of education, standards are an ever evolving process, and are often tweaked from year to year.
Recommended Further Reading in Standards-Based Grading:
- Robert Marzano (https://www.marzanoresearch.com/)
- Ken O’Connor (https://www.oconnorgrading.com/)
- Frank Noschese (https://fnoschese.wordpress.com)
- Kelly O’Shea (https://kellyoshea.blog/)
About the Author
 Taylor is the Dean of Mathematics at the North Carolina School of Science and Mathematics. He’s previously taught in Dallas, TX, and Atlanta, GA before moving to Durham, NC. Taylor’s professional interests are in standards-based grading and interdisciplinary coursework between mathematics and computer science. Outside of the classroom you’ll find him running with the cross-country teams in the extreme North Carolina humidity.
