Let’s Get W.I.L.D. – Wiki Independent Learning Day

Yes, apparently I am obsessed with acronyms this summer.  But, when you can make them fun (WILD) and mean something great I just cannot help myself!

I teach 6th and 7th graders.  Middle school is their transition time.  It is when they begin to grow up and become independent learners.  Becoming an independent learner is a corner stone of our school philosophy.  I know that this takes time and can even be difficult at first, especially for students coming fresh out of elementary school.  My goal is for all of my students to move from being dependent upon me for all of their learning, to becoming independent learners.

To help my students achieve independence in their learning, I am going to have designated WILD days this year.  On these days I will have students start on our student created wiki help pages to access websites to work on different concepts.  They can start with concepts in which they are not proficient.  Students that are proficient in most concepts can work ahead so that they will not be bored reviewing concepts they have already mastered.  They will keep an online WILD Log that they create using a Google Doc spreadsheet.  This GDoc will be shared with me so that I can monitor their progress.

I expect that helping students target what they need to work on and finding the best resources will be high maintenance at first.  Eventually however, I would like the students to learn to tailor their own learning.  I want WILD to be interesting and challenging for students of varying ability levels.

Here is what I have for the GDocs WILD Log, but I would love more ideas on how to make the Log (or anything else) better.

Student Made Geometry Booklets Improve Assessments – Creativity Strikes Again!

I was not looking forward to teaching the geometry chapters to my students this year.  These chapters are full of definitions and formulas.  My own children are in first, third, and fourth grade.  The homework that they bring home indicates that the kids have been seeing the same basic definitions and shapes from at least the first grade, and the same formulas from at least the fourth.  This all equates to me teaching the same thing to the same kids, again.  Can you say Snooze-Fest?

I considered doing a short geometry review and then just diving into fun geometry problems!  However, I have students from several different elementary schools.  I have learned this year that I have to be careful not to generalize and assume that all of the students have been taught (and will remember) all of this previously taught information.  I did not want to skip over the basic definitions that they will need for our more advanced geometry problems if they have not seen them in the past (or they were actually snoozing).

My solution was to have the students create their very own Geometry Booklets.  They made them from folding copy paper in half.  Each night, I assigned my students sections of their textbook to extract and copy down definitions and illustrations.  What they needed to find each night was easy as all of the important definitions and terminology are either hi-lighted yellow or outlined in green boxes.  I encouraged (but did not require) them to be creative and colorful at night!  It told them that it was THEIR book!

The next day class we played games and did activities using the information that they scribed the night before.  They were able to reference their booklets for these games and activities.   To motivate them to get all of the required information into their booklets, I let them use the booklets on geometry unit quizzes and tests.

I felt that this was similar to “flipping” the class because they gathered the information from their textbooks at home and then worked on problems in class.  Most of my students liked it because they got to be creative with their booklets and they felt like they were “getting out of” math homework.  And, they LOVED using these booklets for tests and quizzes.

For the big geometry unit test I let them use their booklets.  The test covered two chapters of geometry.  Overall, my students scored higher on this assessment than they had scored on any other major assessment all year (and I usually only test on one chapter at a time).  But, what amazed me, and them, the most is that many of the students didn’t really need to use their geometry booklets during the test.  By writing it down each night, and then going over it each day, they had already processed the information.

To create the covers for their booklets, we integrated with Art and Gardening.  Students studied cubism in art and then visited their garden to pick a subject for their covers.  Their covers had to be modeled after cubism and include four different geometric shapes.  In art they sketched their garden subject using geometric shapes.  They then used a wide array of materials of various textures and colors to finish their covers.  Our Art teacher did a fabulous job with this and their covers turned out beautifully!

To showcase their work, I made a slideshow of their books to the tune of “The Nonagon” by TMBG.  We all really love that song!  I included the cover and one page on the inside of each book.  I collected their booklets and will return them to the students to use next year during the geometry unit.  I may even have them add on to the books.


Amazing Algebra Tiles

Not like I’m opinionated or anything, but if you are teaching students younger students (or struggling students) algebra and you are not using Algebra Tiles, then you are missing the boat!  Not that I can be too judgmental, I had them on my shelf and missed fabulous opportunities to use them all year.

I bought them solely for multiplying polynomials with my 7th graders.  I only bought a few sets because I didn’t want to waste too much money if we all hated them.  I have taught older students Algebra (Pre-Algebra, Algebra IA, Algebra IB, Alg II for seniors) many times in the past and never used them.  With those classes the kids had seen Algebra before, sometimes many times, and I didn’t think it would benefit them very much.  The tiles seem very elementary, not to mention a lot of trouble, and I was afraid it would be, “too little, too late”.  So yeah, I was WRONG again.

I pretty much bought them for one purpose.  I wanted to show 7th graders who had never multiplied x by x to SEE the difference between

x + x = 2x     and    x times x = x^2.

Plus, they are young (12-13) and thus more concrete thinkers so I felt it was a good tool to use for this age group.  I wanted to explore taking them from the concrete to the abstract with Algebra Tiles.  I was skeptical but hopeful.  I’ll try anything once!

However, once I pulled these things out though there was no stopping us!  For the first time ever, my students did not mix up 2x and x^2.  W-O-W.  If you’ve taught Algebra before, you know that is big.  My students knew not only what it meant, but what it looked like.  They knew why the 2x and x^2 were different.  They did not ask me a gazillion times if it was 2x or x^2.  And if they did, all I had to do was pull out three tiles and viola – instant understanding.  I mean, HELLO – Look at them!  They look nothing alike!  You cannot ask for a better explanation than that!

One thing that I discovered that really helped my students is how you can represent negatives with the tiles.   This was wonderfully helpful with multiplying a negative through a polynomial.  My kids always stumble over that or even “forget” it.  However, since we have been doing the tiles they can see what they are doing and are no longer forgetting it.  Bonus!

I bought them to teach polynomials to 7th grade, but once I got them out, I have not put them away!  The tiles put ACTION with the MATH.  More great uses for the tiles:

  1. Illustrating the distributive property.  As fun as “The Claw” is, seeing is really believing for my students.
    3(x + 2) is just THREE sets of x and three 2’s.   (Ahhh,… so THAT’s what we’ve been doing all year.)
  2. Negative Operations – The opposite of a positive number is it’s negative.  For the tiles, to get the negative (or opposite), we flipped the tile over to the other side.  (one side is yellow – positive, the other is red – negative).  This can even illustrate basic concepts, like – (-4).  What is the opposite of  -4?  Flip it over and see!
  3. Multiplying a negative + distributive property.  – (x – 3)  or  -2(x – 4).  When you see   – (x – 3) you are taking the opposite of (flipping) everything inside of the parenthesis.
  4. Equation solving – I draw a line down the center of the paper and use the algebra tiles to solve equations.  When kids tried to subtract 4 from 6x, I would take out 6 x-tiles and 4 constant tiles and say, “Now, how can I combine these?”  The answer, “Oh you can’t, they aren’t like terms.”
  5. Equation solving – divide by a number.    3x = 6.  Three x’s = 6, so one x must be 2.  Then, I would split the x’s and line up the constants on the other side, dividing the x’s.
  6. Equation solving – FRACTIONS.    x/2 = 3 .  If HALF of an x = 3, then what does an entire x equal?
  7. Multi-step equation solving – This was especially helpful when I was teaching multi-step equations.  With tons of tiles spread out all over the paper, the students could easily SEE that of course I needed to combine like terms before trying to get x alone on one side!

(I used Hands On Equations at the beginning of the year, but I think that the Algebra Tiles beat them “hands” down.  They are just more intuitive, especially when it comes to the negatives.)

Of course I still do my crazy songs, dances and rhymes so that math will be stuck in their brains – FOREVER.  (And yeah, I just LOVE to sing and dance!)  But, I think that it is important for every student to know what they are doing, and not to just be  following random steps!   So, one day in the future, when they can’t get our annoying equation song out of their head, maybe they will also recall the Algebra Tiles, and remember WHY x times x = x^2 and NOT 2x.

Links:

Algebra Tiles Video

Interactive Online Algebra Tiles

Math Hunt – Time for Targeted Help

Do not delay, try this activity NOW.

Whenever I discover an activity that lets all students in my class work at their own level while I get to assist students that need extra attention I have to share it.  I know that many other teachers are already using this activity, but for those who have not yet discovered it, I must insist that you try it now.

A great friend of mine who is an amazing teacher uses this game regularly in public school with classes of 35 students, and it works for her.  She has been telling me about the virtues of this activity for two years (thanks Les!), but it always seemed like too much work so I didn’t try it.  I was wrong.  It is not much work at all.  It is very easy to plan, and the kids love it.  But, best of all, it is an activity where every student in your class will be challenged at their level.

 Procedure:

  1. Make up at least 16 math problems.  (I would do more if I had a larger class.)  Make them progressively harder.  Make the first few very easy and make the last few really tough!
  2. Print these 16 problems on one sheet of paper.
  3. Fold the paper in half.  The question is on the outside.  Write the answer on the inside so it is not visible.
  4. Assign each paper a number from 1 – 16, marked very visibly on the front.
  5. Place (tape/tack) these problems all around the room, but not in order.  This is where the “Hunt” comes in.  They have to find where the next problem is.
  6. Assign students a “start number” based on their ability level.  Struggling students would be assigned #1, advanced students #8.  I usually assign two or three students to each number to start.
  7. Students will go in order.  If they start with #5, the next problem they work with be #6.
  8. Students travel at their own pace – they do not have to wait on the other students that were assigned their number to finish the same problem.
  9. Have the students write down the question and all work on their own papers.  Once they are finished with a problem, they can check the answer.  If they miss it, they have to RE-work the problem.  If they can’t figure it out, they can call you over to help them out.
  10. Be sure to tell them that they will probably NOT finish all of the problems in a class.
  11. Some students WILL finish all of the problems.  When they come to you to tell you they are done, you can them make them “additional helpers”.  They walk around the class assisting students who need help using the work on their papers.  I do not tell students this in advance, as I don’t want them “racing” to get finished so that they can be a helper.

 Additional thoughts:

  • I taped beginning problems to the tables so that I could have room to sit with struggling students and help them.
  • I didn’t want to waste 16 sheets of paper so I printed out 16 problems on one sheet, cut the problems out, and then glued the problems to the outside of recycled paper.
  • Next time I am not going to make the easy problems #1.  I am going to make the easier problems start at #8 and then go from there.  (So the hardest problem would be #7).
  • I let students help each other as long as they are not just telling each other the answer.

You don’t have to make the last problems really hard, especially if you have a large class and aren’t going to have the time to help out your advanced students too.  Don’t feel bad about this.  When they “fly” through your problems, they get to help teach their peers.  And, we all know how much more we learn when we are teaching something.  Everyone still wins!  J

I did this activity so that I could work individually with struggling students and so that advanced students would get a chance to work on really challenging problems.   A fabulous side benefit of this activity was that my advanced students needed my help too!  These are students who usually “get everything” the first time and rarely need my help.  I was thrilled to get to work one on one with them as well.

I talked Elissa into doing this game today.  I really hope that it went well for her.  I am sure that she will make it better AND color coordinated.  I am hoping that she will blog about it as well because I am looking forward to stealing some ideas from her (hint, hint Elissa).

Suggestions Welcome!

Some of my students wanted a “prize” at the end for finishing.  I didn’t want to do this because not all students would finish and I did not want them to feel bad about that.  Plus, I didn’t want them to rush to finish (and feel like they just needed to get the right answer).  I wanted them to focus on the “process”.  But, there is usually something at the end of a scavenger hunt…

Linear Equations – Plotting and Predicting Measurements

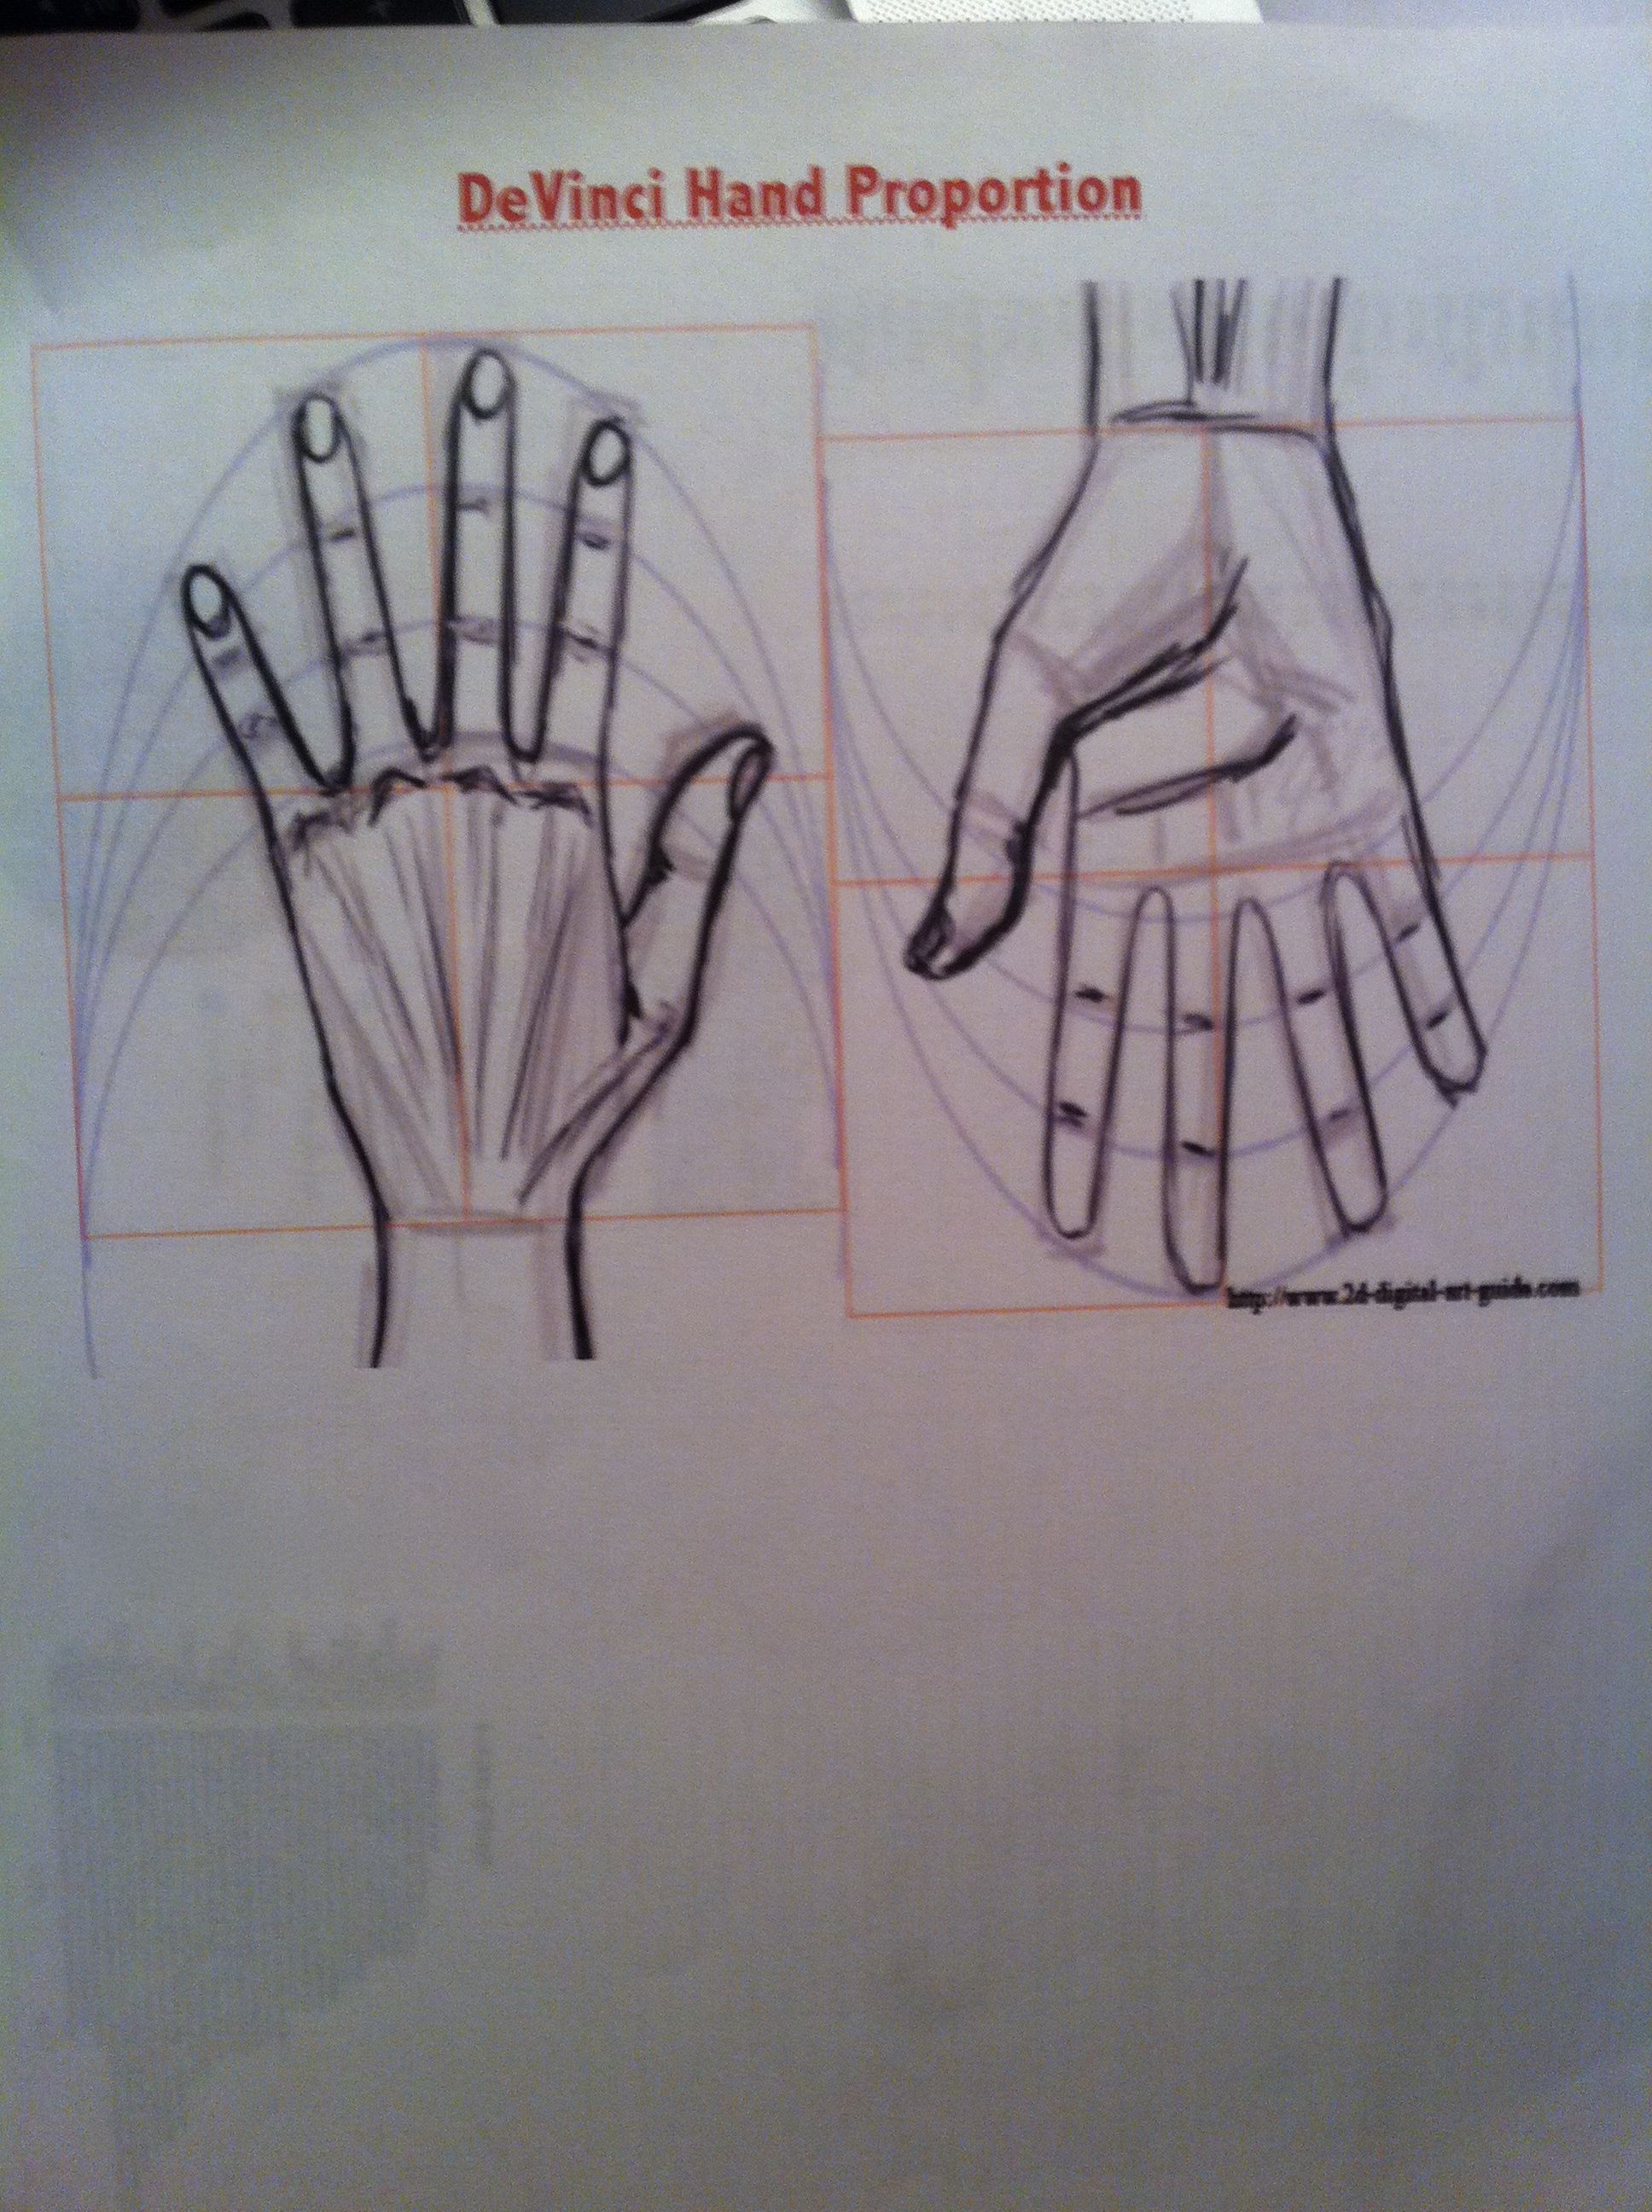
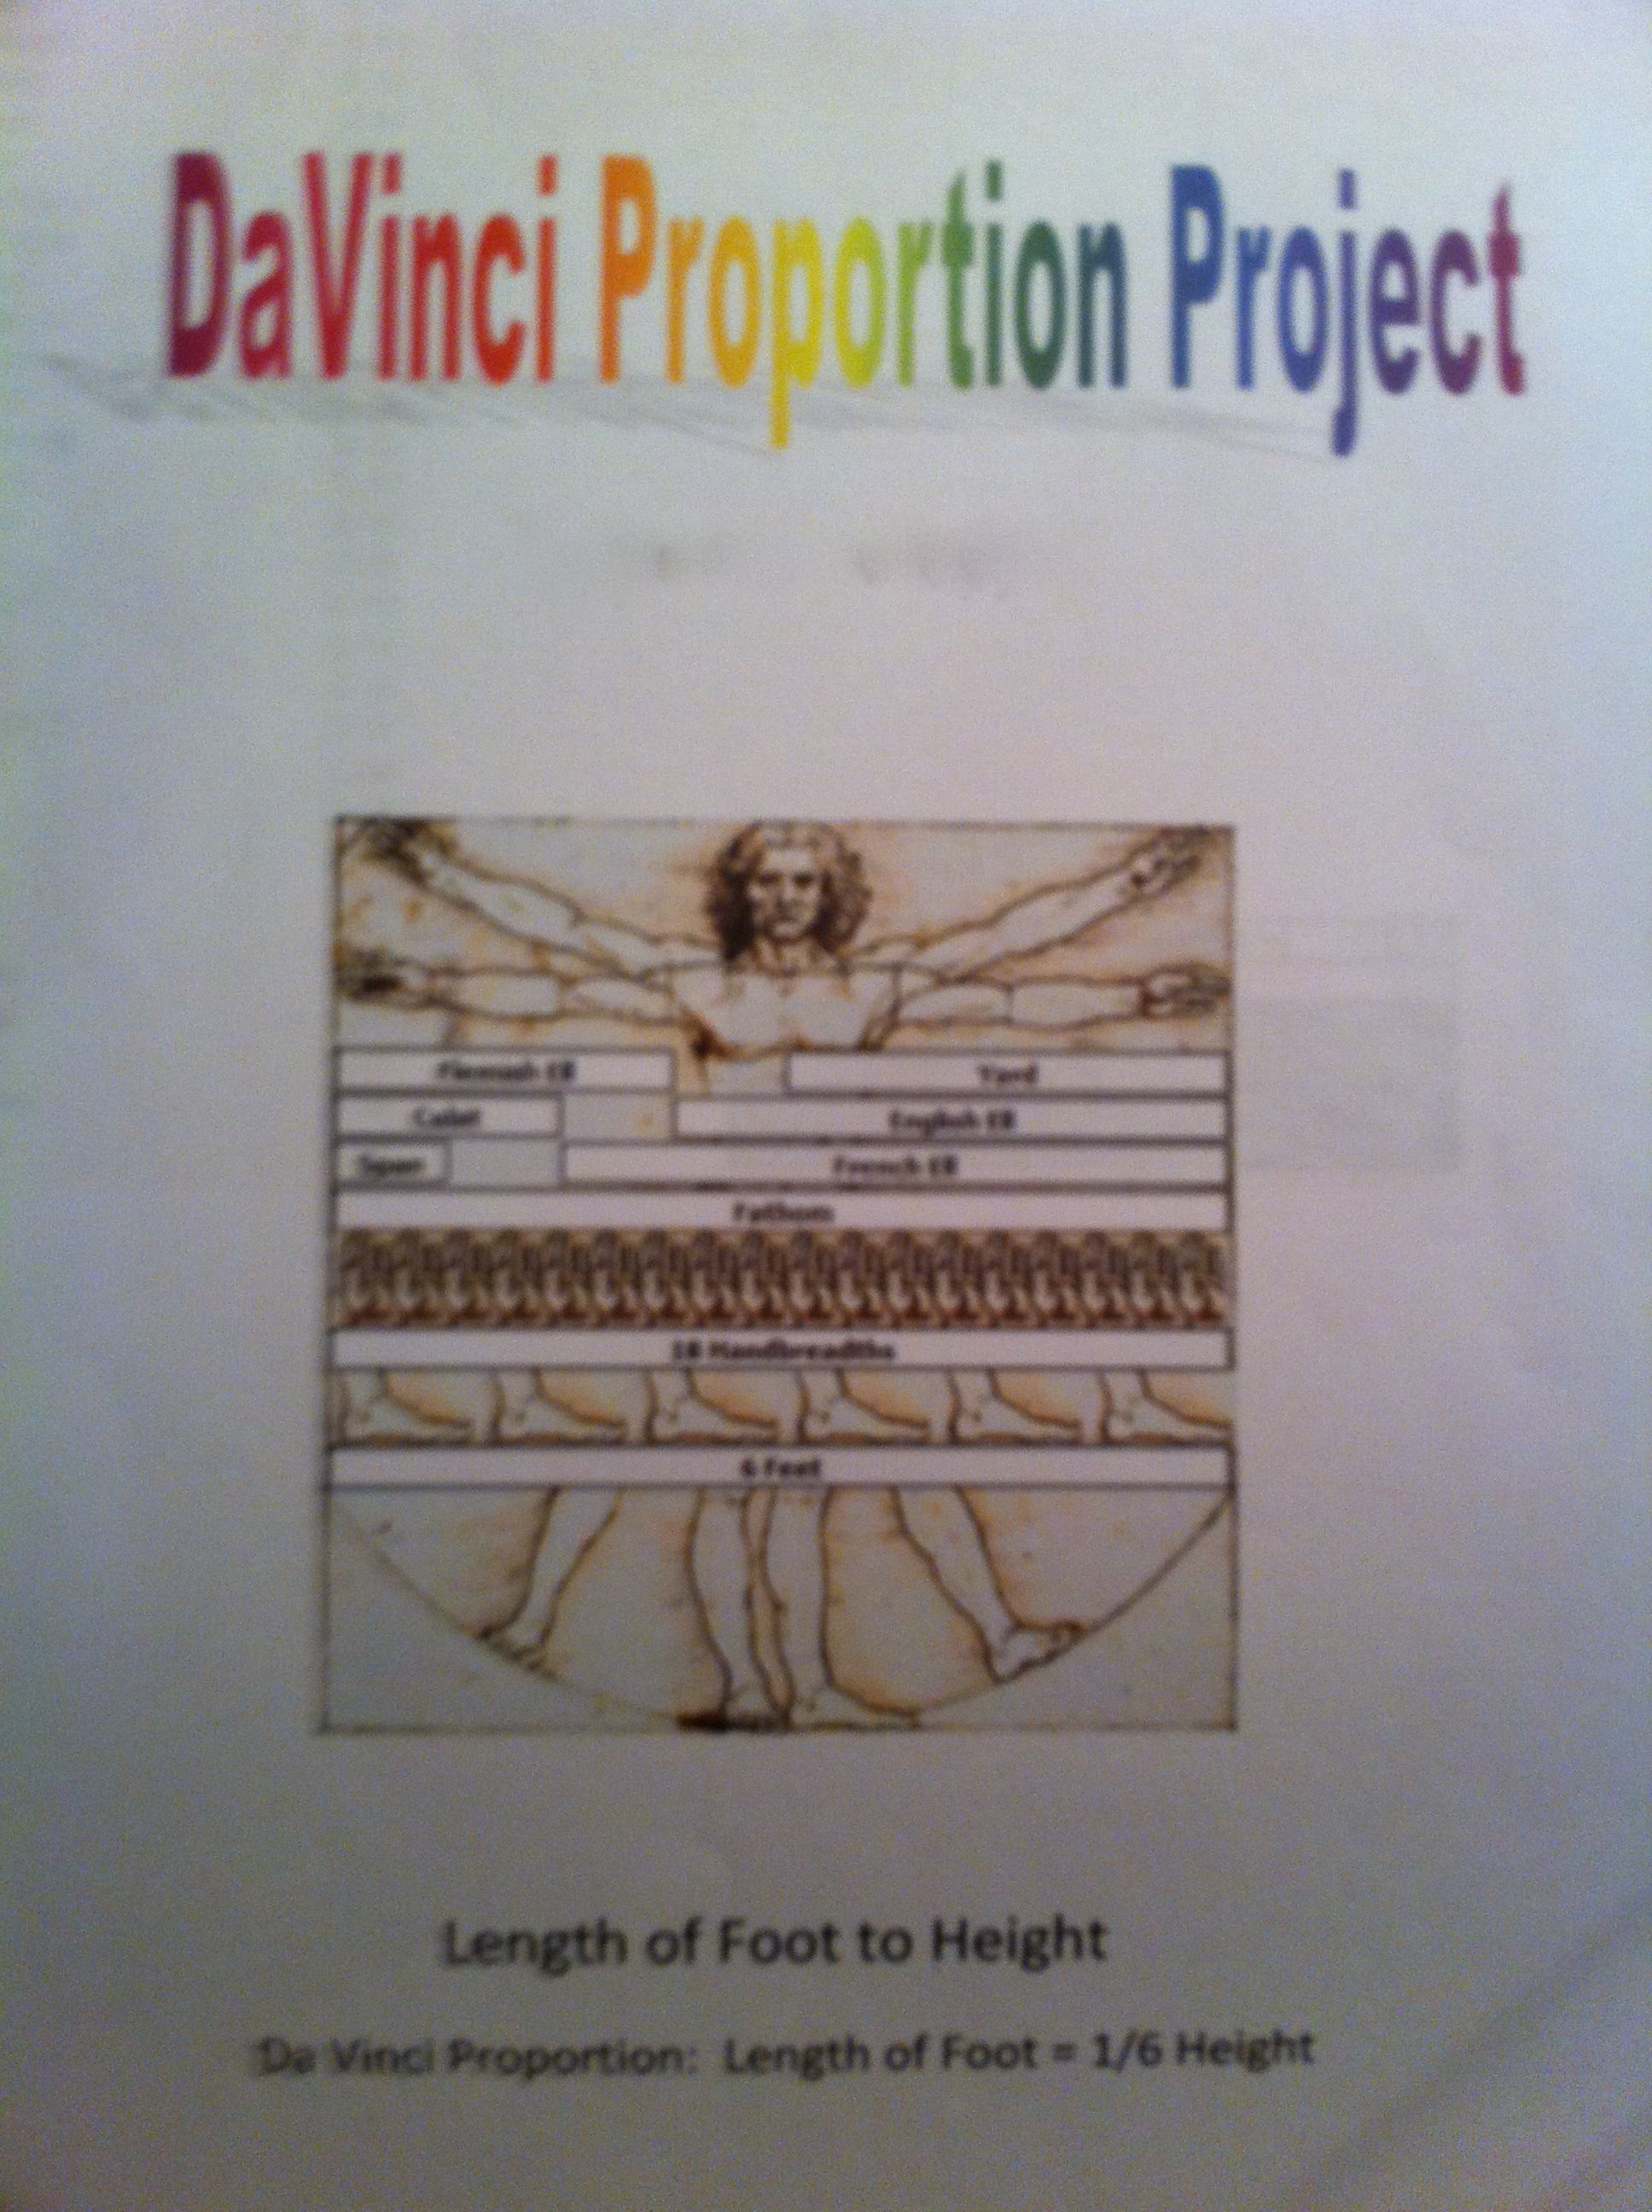
Given someone’s height, I wanted my students to see how well they could predict other measurements (like head circumference, arm span, foot length, and hand length).  They used measurement data that they had collected (their very own measurements), and then used scatter plots and lines of best fit for their predictions.

We are learning about graphing, including functions and linear equations.  They plotted ordered pairs the first day, and then learned about functions.  Now it was time to investigate linear equations.  This is an amazing part of mathematics not only because it is so interesting, but also because it is useful!

Plotting the Data

Plotting the Data

I have been told that students grow like weeds in middle school.  Since the beginning of the school year, my students have been recording their measurements every couple of months.  They measure their height, arm span, head circumference, foot length, and hand length in inches.  I had them fill out a Google Docs Survey which then organizes their data into a Google Docs Spreadsheet for us.

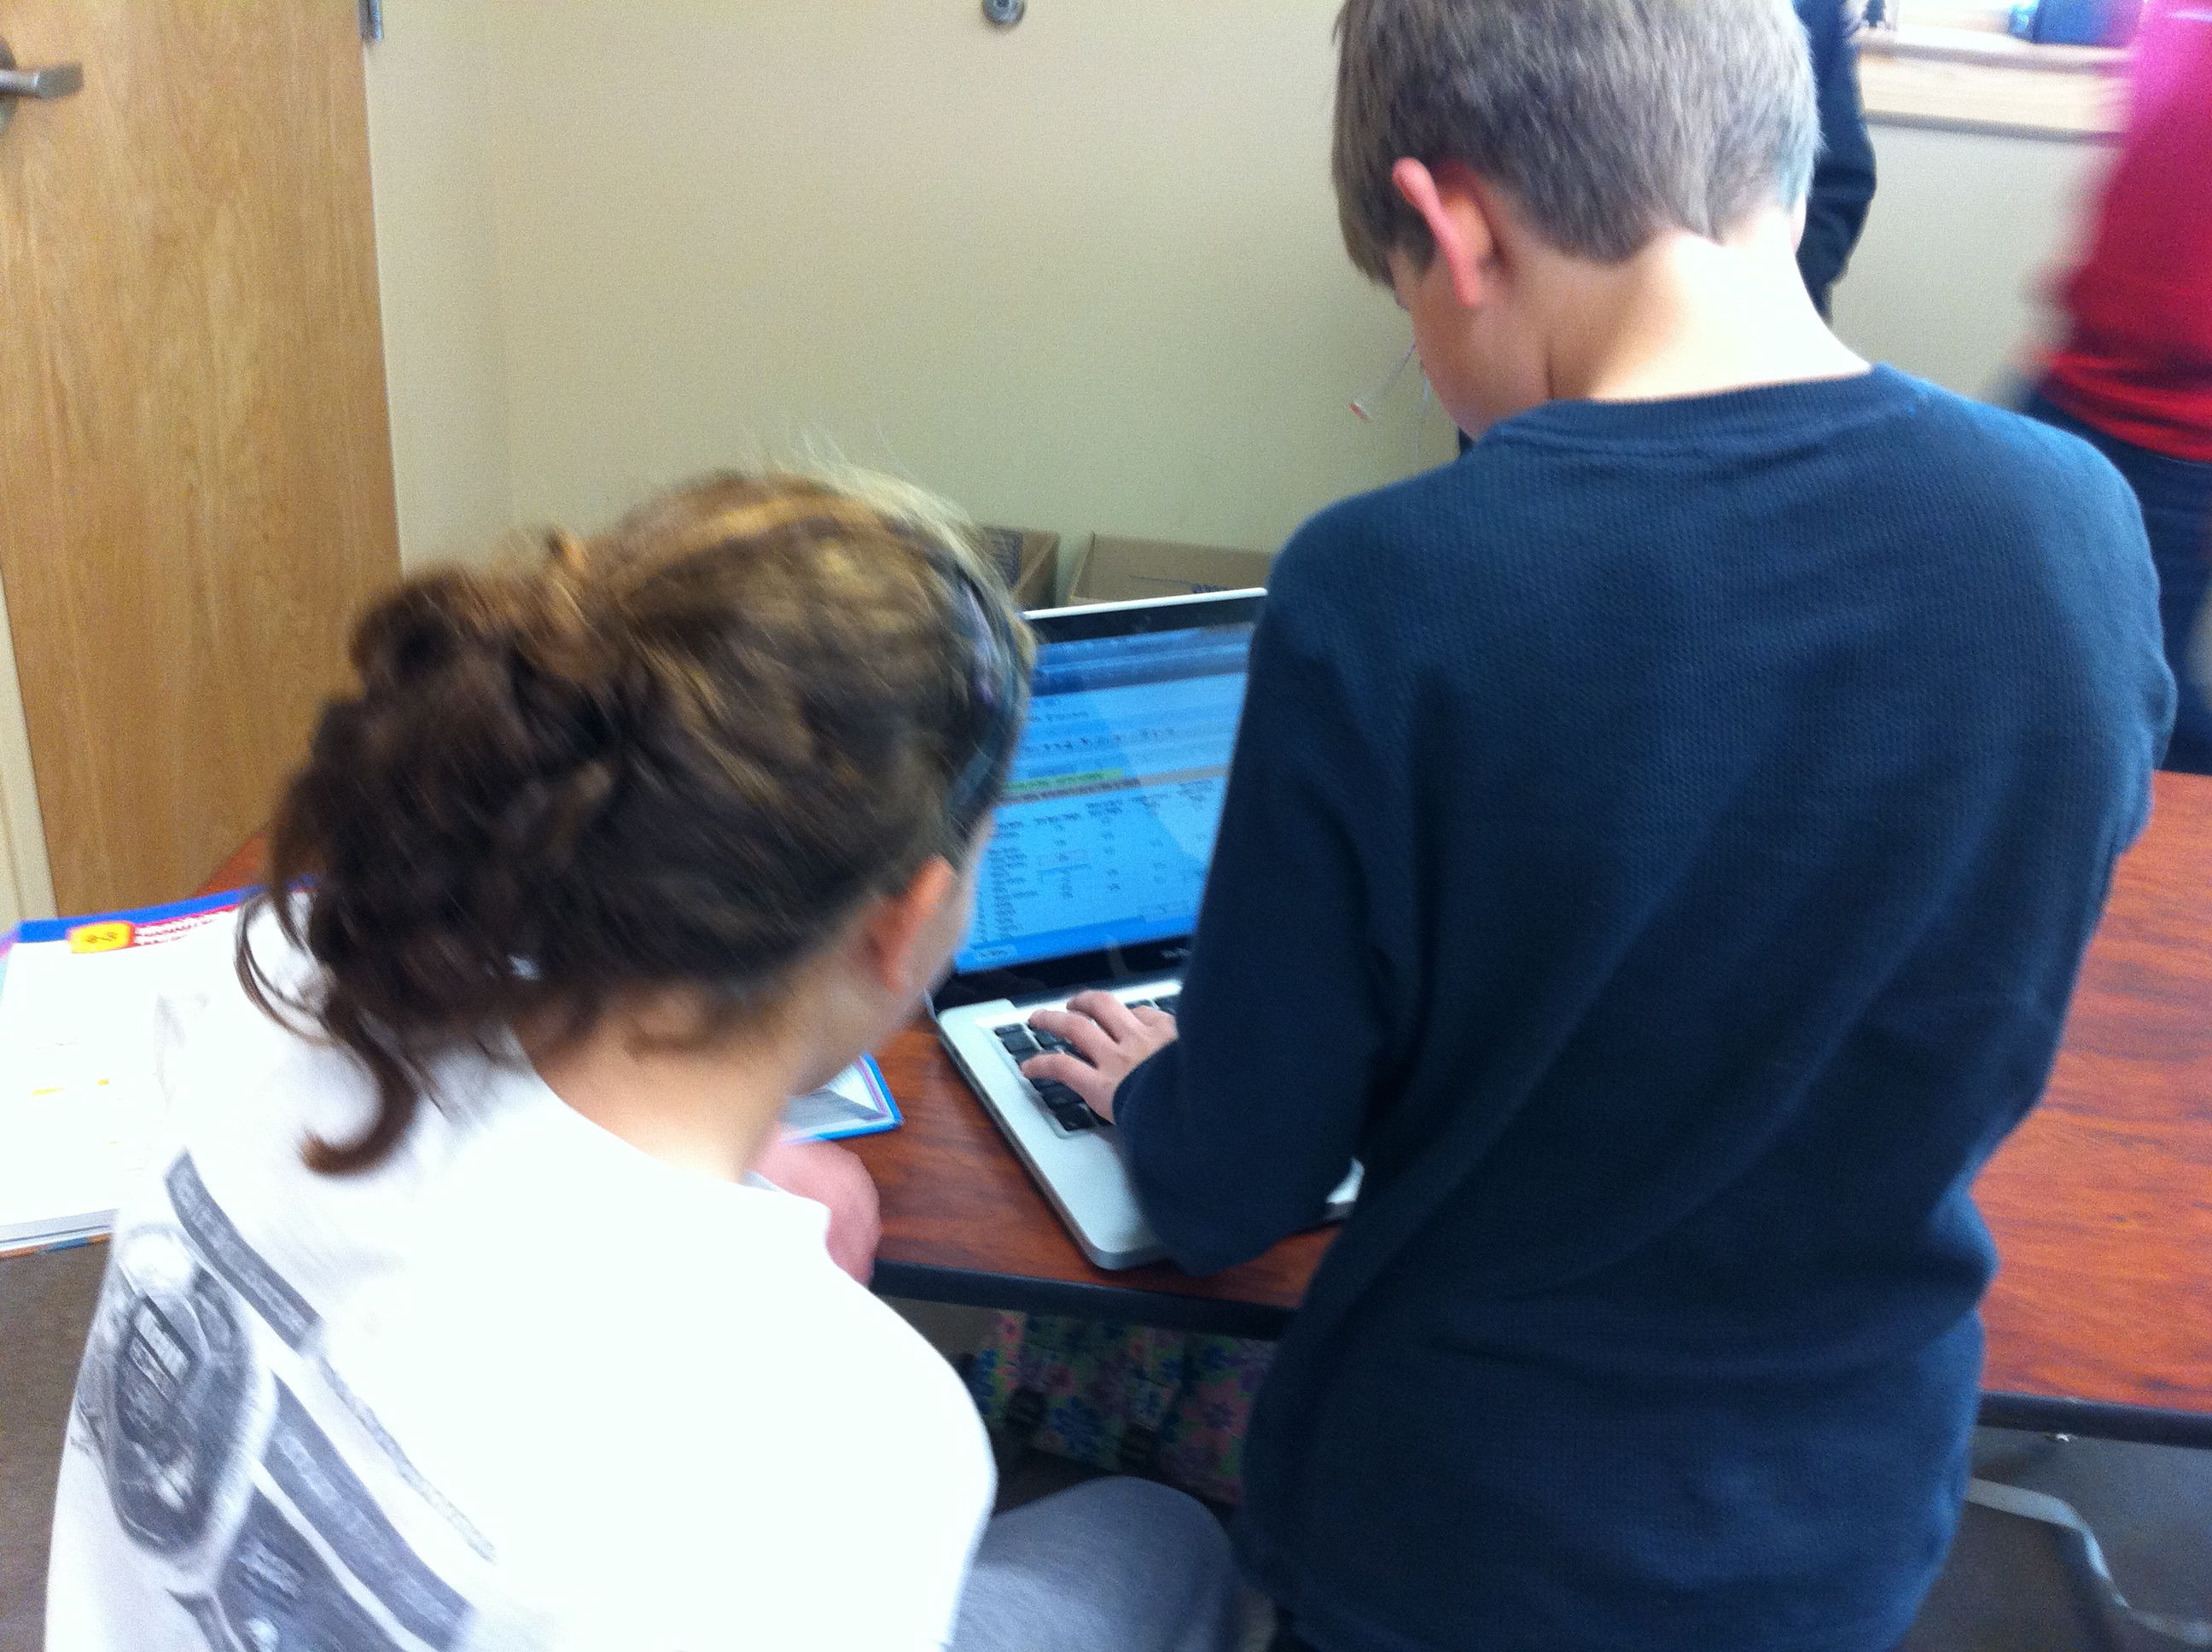
In class I had the students measure each other again so that recent measurement data could be included in our data set.  For homework, they were to enter their measurements onto the survey and measure each member of their families height in inches.  At the start of class I gave every student a piece of graph paper, a ruler, a worksheet, and a computer.  I then assigned each group a data set to analyze (head, arm span, foot, or hand).  We were making all predictions based on height (the x-axis), so everyone kept the height column and one more data set (the y-axis).  They duplicated the GDoc data sheet and deleted the columns of data that they were not assigned.

In order to determine the scale for the x-axis and y-axis, they calculated the range for their data sets.  This led to a great discussion about how this range would only make a good scale if we were just measuring middle school students.  But, we also wanted to be able to predict the measurements of people of other ages and sizes.  So, we expanded our range to find a more optimal scale that would cover all of the people that we had measured the night before.  We then discussed scale and counted the grid lines on our graph paper to determine how to number our axes.

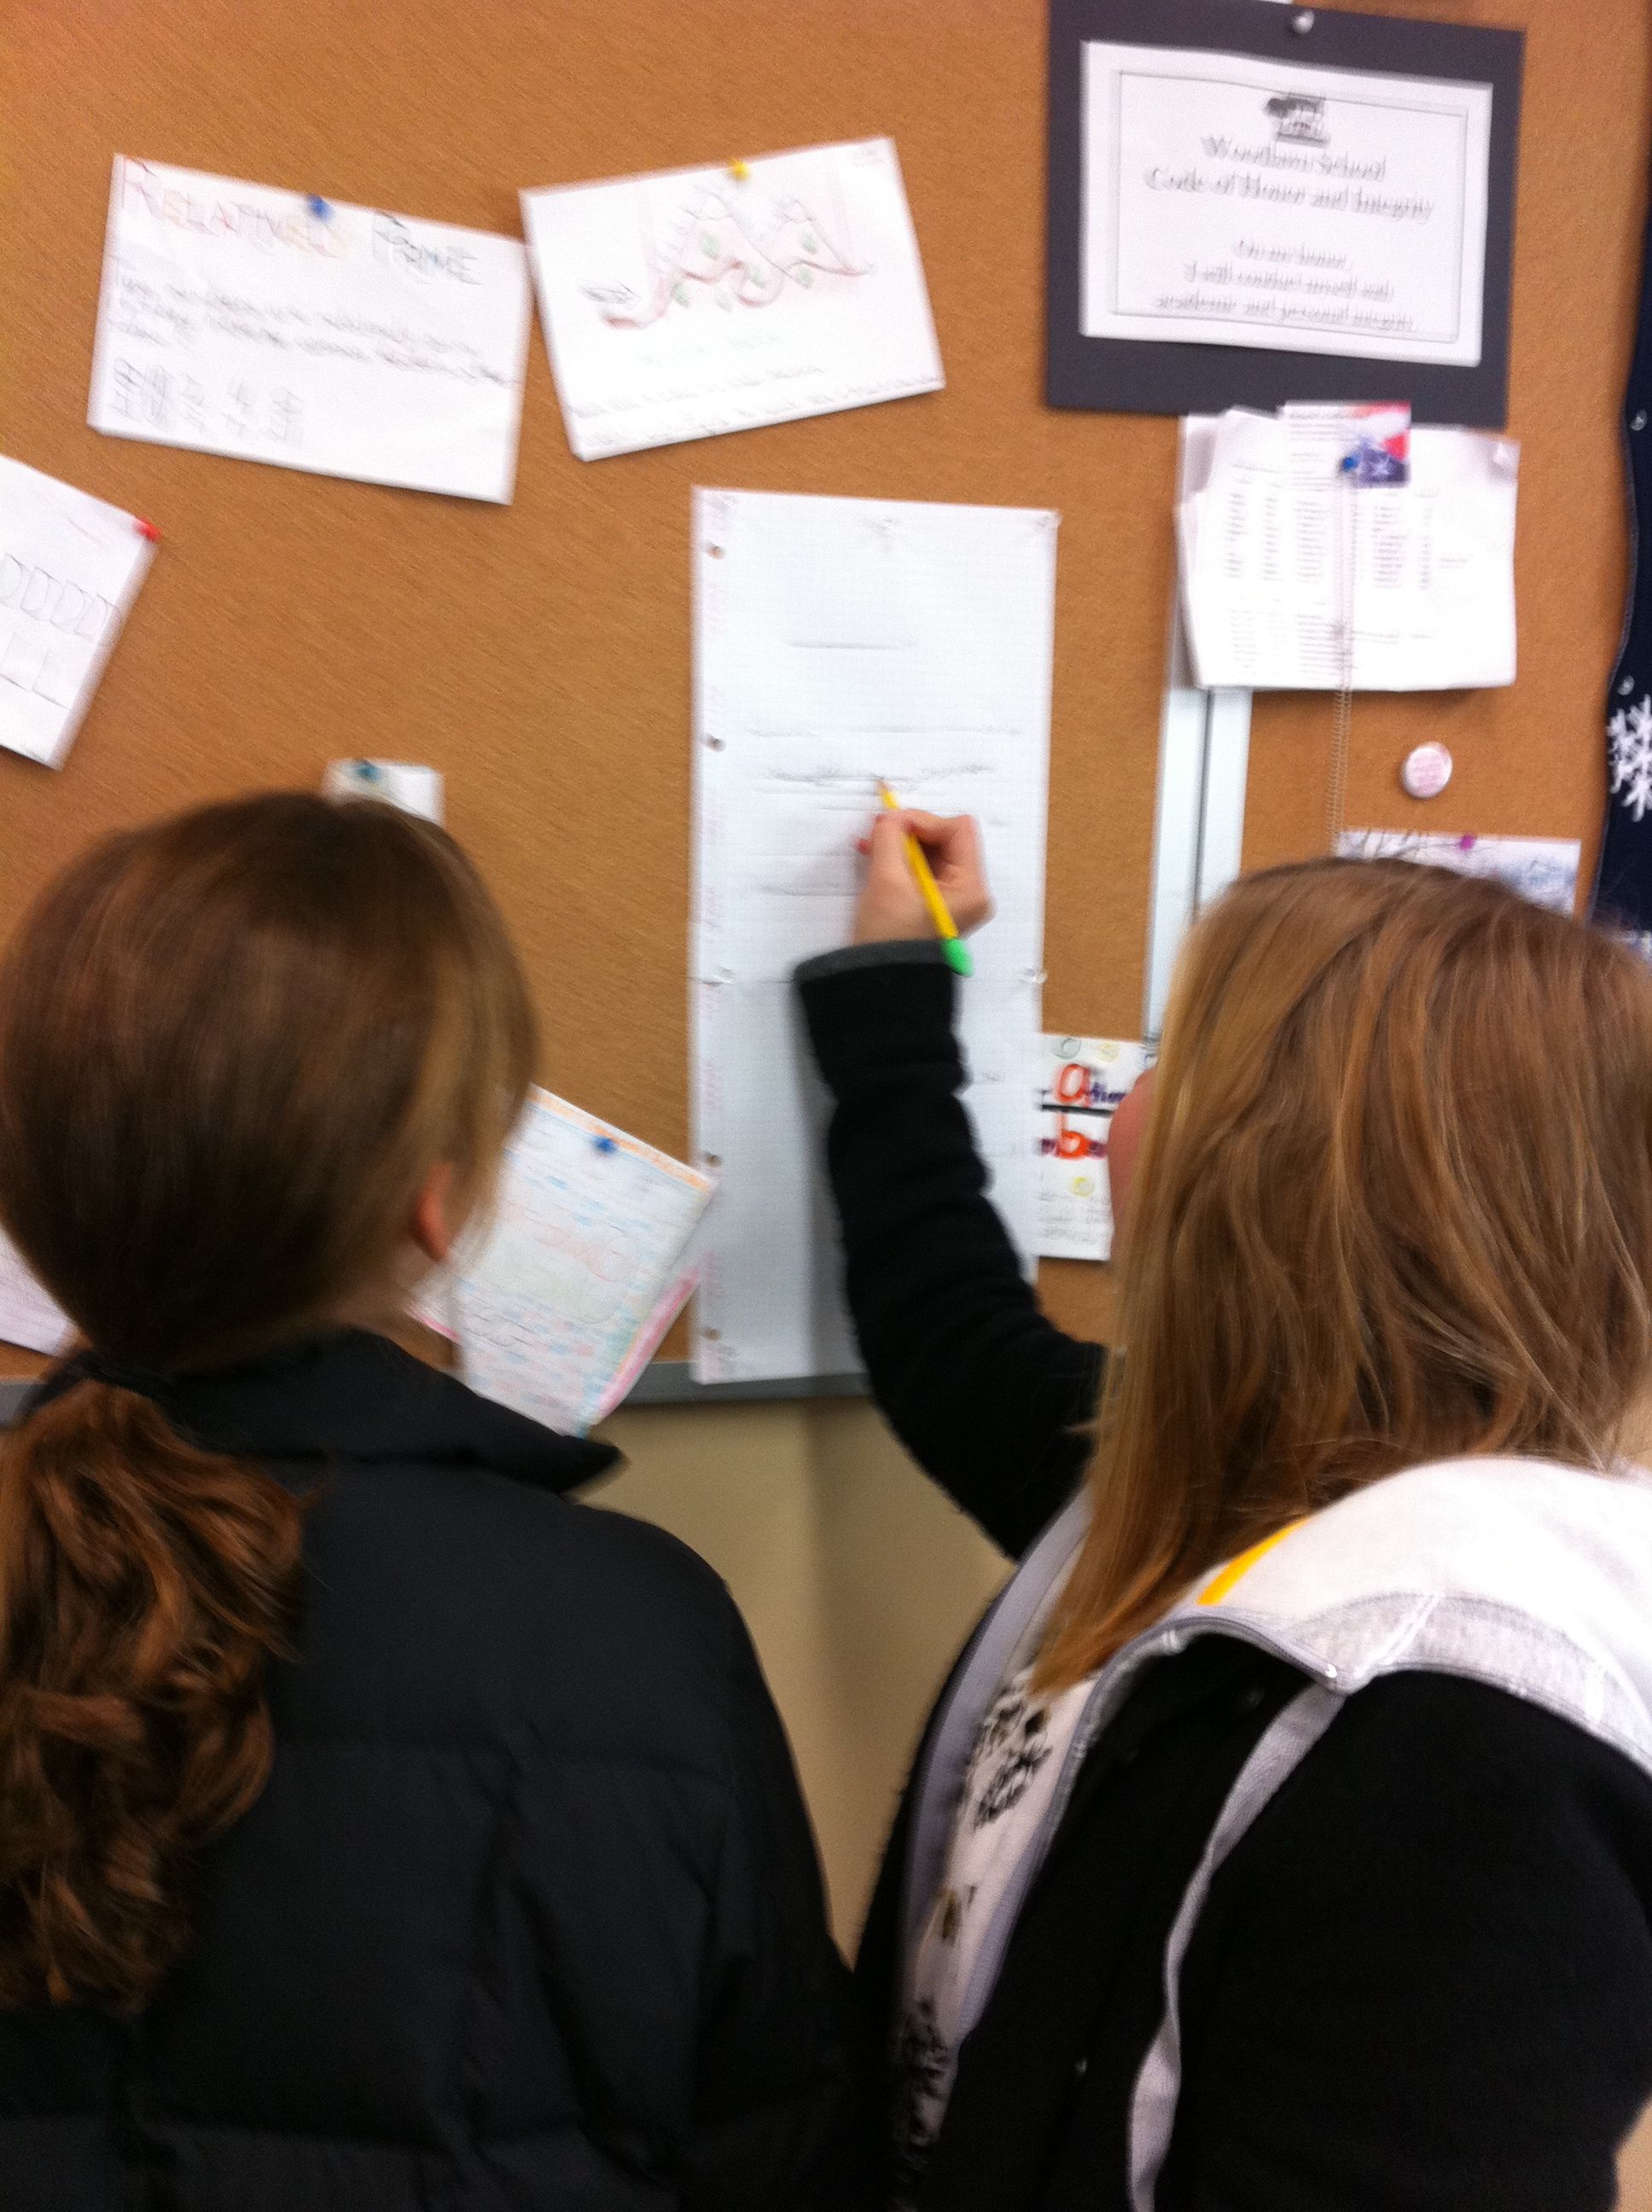
After our axes were labeled and numbered it was time to plot points.  I let them plot for about 10-15 minutes, which was not near enough time for all of our data!  This needs to be a two day activity next year to get the most out of it.  I explained the line of best fit, and showed them a picture of a scatter plot with a line of best fit drawn on it (from Excel).  I had them draw what they thought was a line of best fit through their data points, and instructed them to draw their line across the entire paper so that they could make predictions for various heights.  **  When drawing their lines, be careful to instruct them not to cross the x-axis, as then their line will intersect the y-axis below 0.  People cannot have negative measurements! **

To show them how to make their predictions, I had them fill in the height data that they had collected the night before from members of their family.  They plotted their family members height on the x-axis and labeled them.  I illustrated how to go up to the line of best fit, then go over to the y-axis to predict their family member’s other measurement.  They recorded this and for homework tonight they will find the actual measurements of their family to compare.

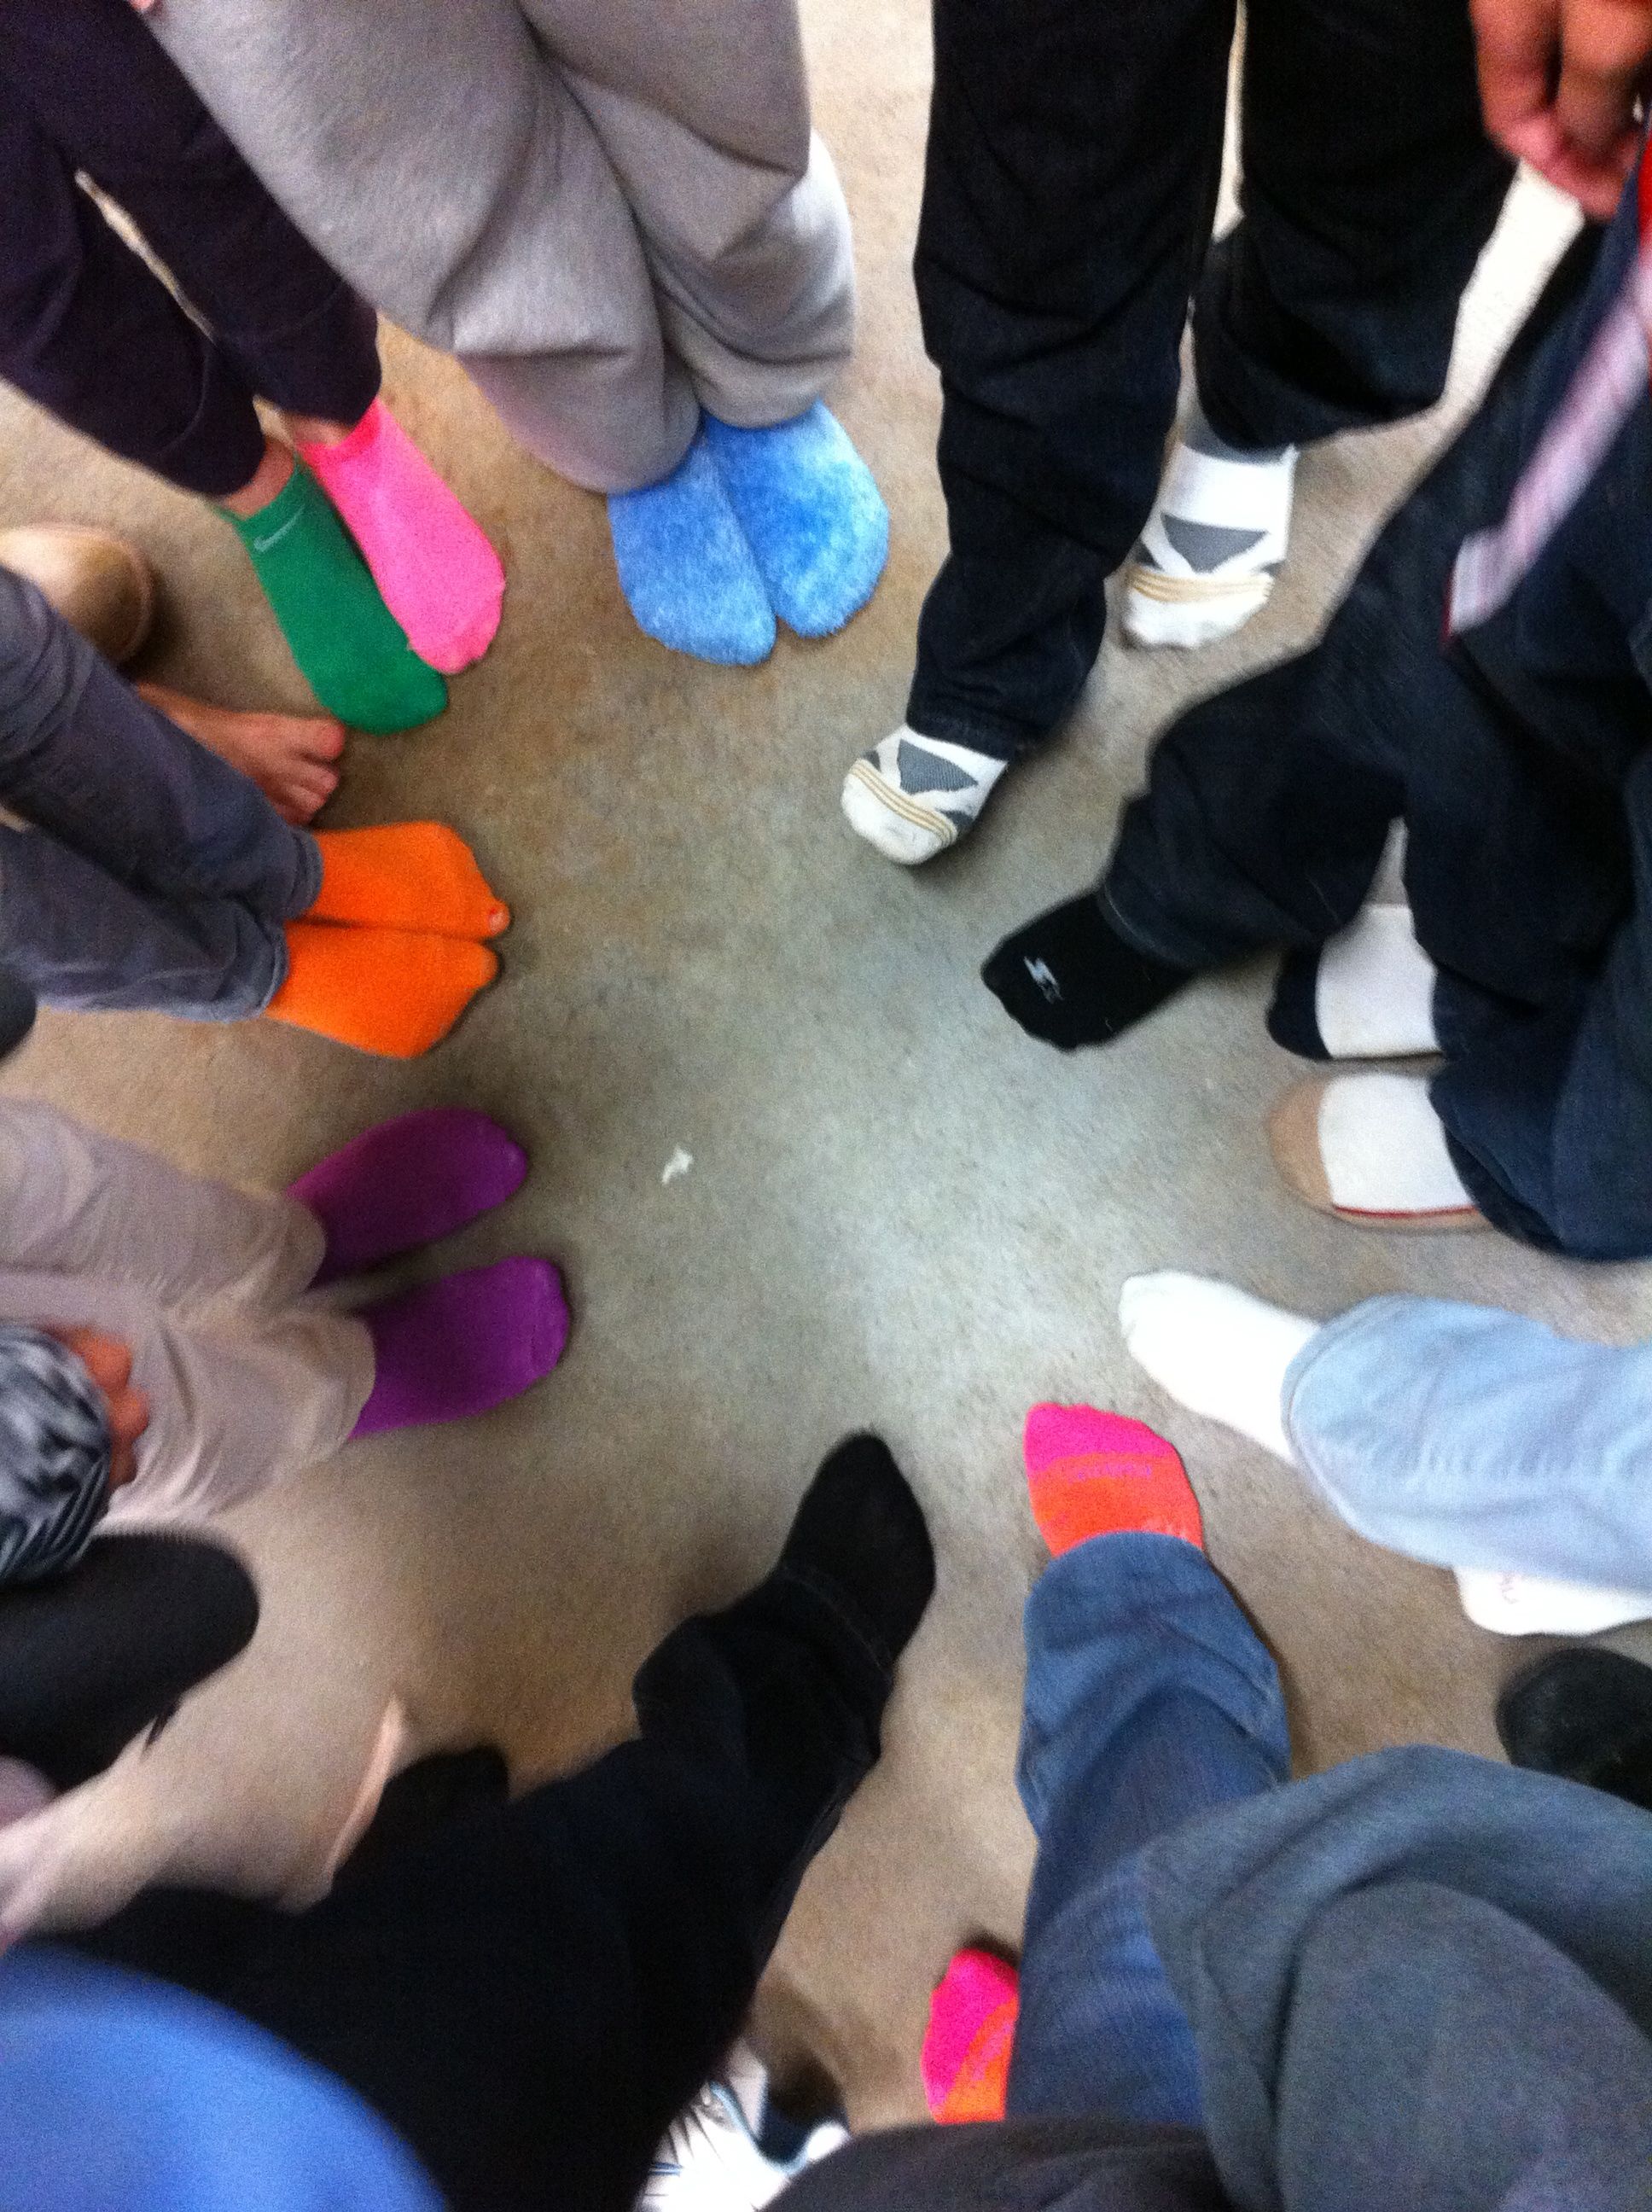
Enter Mystery Guests!

This was our favorite part!  I arranged for 4 – 6 mystery guests to come in at this time.  I wanted to measure people of varying heights and ages.  Our mystery guests included students (1st graders, a 3rd grader, a 7th grader, some seniors) and teachers from our school.  We measured their heights and then predicted their other measurements using the students lines of best fit.  While the students worked on their predictions, I had the mystery guests measure each other to find their actual measurements.  The guests then walked around the room to see how close the students predictions were.

The mystery guest portion was not only the most fun, but also the most informative piece of the lesson.  We were able to discuss why some measurements were more accurate than others.  They discovered that a big factor overall was that our data came only from middle school aged students.  Thus, our data wasn’t as accurate of a predictor for people that weren’t “middle school size”.  Also, they determined that some factors were much better predictors overall, such as arm span.

For homework, they were to go home and measure their family members actual measurements to see how close their predictions were.  I also had the students write a reflection on our class wiki.

We had so much fun with this activity but it was a real crunch to get it done in 50 minutes!  I will definitely do this again next year, but I will take two full class periods.  I would like to go deeper into numbering the axes, spend more time plotting the points, and have more time at the end to analyze the results.  Next year we will analyze our data, spend more time plotting points, and then work on our families measurements the first day.  Our mystery guests will open day two!  From reading the students reflections, it was clear that they really enjoyed this activity too!  Win-win!

Marvelous Math Stations

Hi!  Be sure to follow me on Twitter for more updates!  I am @jreulbach.  🙂

This was the BEST review activity I have ever done!
I even overheard a 7th grade boy say, “Wow, this is FUN!”  That my friends, is hard to do – especially in math class when we are working on solving multi-step inequalities!

I love math stations because:

  1. They allow students to work on their own level, at their own pace.
  2. Students are doing all of the work and problem solving the entire class period instead of watching and copying what I do.
  3. They allow me to work individually with each student as needed.

This is an activity that I use to review a concept or several concepts.  I make about 8 stations with two problems in each station.  I give each student a blank Math Stations Worksheet .  Then, I assign students to the first four stations.  Station 1 has problems that are less difficult, and as students progress through the stations the problems get more difficult.  Students that need more help start out in station 1 with easier problems.  More advanced students are assigned to higher stations according to their ability level.

When students finish with a station, they come to me to see if their answers are correct.  If they are correct, they advance to the next station.  If they are incorrect, I work with the student and then they try again.  They cannot move on to the next station until they master the problem in their current station.

I usually put basic problems or review problems in Station 1.  This is a great way to catch students up who have been absent or are just having a difficult time with a concept.  In levels eight and nine, the problems are challenging.  Not all students will make it to levels eight or nine.  But, if they are able, it allows them to work challenging problems instead of being bored doing the same type of simple problems over and over again.

I also have students carry an index card with them from station to station.  When I help a student with a concept (like – remember to reverse the inequality sign when multiplying or dividing by a negative), they can jot it down on the card.  At the end of class, this card has reminders of the things they had the most trouble with.  I have noticed that most students make the same errors over and over.  Hopefully they will use this card when they get stuck or can’t remember what to do.

Edit: After sharing this with Kristen Fouss after posting, she shared this fabulous activity with me!  I loved her color and her cute idea!  All I had to work with was colored index cards, so I colored coded my stations with the index card answers.  This way they can easily (read quickly) find the answers when they are finished with each station.  Thanks Kristen for inspiring me again!  : )

For quick and easy math station creation using a worksheet, read Quick and Easy Math Stations (aka Pimp Your Worksheets).  🙂

Summary – After the Activity:

I have done station before, but this was the first time I did it according to ability level and with progressively harder problems.

Yes, the stations did get crowded sometimes.  And yes, they are middle school students so they did actually fight over the questions and the answers when a station got too crowded!  What do I think about that?  Hello – they are FIGHTING over math problems!  Consider my job DONE.

They wrote great notes on their individual notecard.  However, they kept leaving it behind at other stations.  Anyone have a solution for that?

They worked like crazy the entire period.  It was loud, it was crazy, it was learning at its best, it was FUN!  I walked around and helped when needed.  Some students needed more help than others.

Some students did all 18 problems!  I couldn’t believe it.  There was only about 5 minutes of class left, so I told the finished students to use their work and find someone to help.  I was the happiest when a student who started in level 1 zoomed through all of the levels and finished all 18 problems before the end of class!  Success is a powerful motivator.

Their suggestions:  At the very end, I asked for their suggestions on how to make this activity better in the future.  They said:

  1. Make more copies of the problems and answers so we don’t have to share (fight) for them.
  2. Less problems, but make them harder
  3. More problems, make them easier
  4. Let us work together when we have a question (I told them they had to figure it out on their own or ask me, sometimes when another student helps them they tell them too much and the student being helped doesn’t learn.  I wanted to make sure everyone was learning).
  5. Bring candy for when we are all done!

Off to a foldable and speed dating tomorrow!

Da Vinci’s Vitruvian Man – Ratios, Mean, Median, Mode & Frequency

In our 6th grade curriculum students work on a large, interdisciplinary project on the Renaissance. After having so much fun in the Middle Ages, I couldn’t resist planning some fun with The Renaissance. Since we were studying ratios, I chose the ratios of Leonardo Da Vinci’s Vitruvian Man.  To make it more relevant and interesting for the students, I had them measure and analyze their own body measurements to compare to the Vitruvian Man.

We talked about Da Vinci’s “ideal” body ratios in class.  I picked four of these ratios for my students to analyze, arm span to height, hand length to height, foot length to height, and fingertip to elbow to height.  We wanted their measurements to be as exact as possible, so they stood against the wall for their height and took off their shoes (cue great sock shots).  After measuring themselves, they entered their measurements, as ratios, into a Google spreadsheet.

This was a wonderful extension of our previous Google spreadsheet work because I introduced my students to formulas.  I showed them how to calculate formulas using the formula bar and the equal sign.  Then, I showed them more advanced formulas using the formula menu.  I had them enter their ratios into each cell so that they could still see their ratios, but a decimal was calculated for the cell.  Best of all, they could still read their ratios by clicking on the cell and looking in the formula bar.

Mean, Median, and Mode

After all of the data was entered, I assigned each student a ratio to work with. Each student then duplicated the data sheet, deleted the columns of data that they were not working with, and sorted their column of data (sorting was a new skill as well).  Sorting the data made the median and mode easier to calculate and their subsequent bar graphs more appealing to read.  For the mean I had them use the AVERAGE( ) formula from the formula bar.  To represent this data, they made a bar chart with each student and the mean, median, and mode.

Frequency Table
After calculating the data, we talked about the Da Vinci proportion for their particular body parts.  They then entered that number into a frequency table that I had pre-typed onto the data sheet.  They populated their frequency table with the number of students in our class that were under proportional, exactly proportional, and over proportional according to the Vitruvian Man.  To illustrate the frequency table they created pie charts.

Google Spreadsheet Data Sheet

After their charts were complete they uploaded them to our Da Vinci Vitruvian Page on the wiki and explained their findings in the comments section.

To make this a grade-able project I had them print out their data sheet and charts as well as make a cover sheet.  I showed them how to use Google word processing and Google drawing for the cover sheet (but that was optional).  On the day they were due, the students presented their projects to the class.  We discussed their findings as a class and talked about which measure of central tendency best represented their data.  They summarized that they weren’t very proportional (according to Da Vinci) because they weren’t finished growing yet!  But, they were most fascinated with interesting facts that they fond out about themselves (as in the fact that the person with the smallest hands did not have the smallest hands proportional to their height).  It was great fun!

Solving for Y with Cups and Kisses!

My students beautifully tackled two step equations with ease, showing all of their steps along the way and solving to perfection!  So, when it was time to graph, I decided that we would spend a day solving for y before learning all of the different forms of the equation of a line.  Sometimes as a teacher, you assume a new concept will be easy for your students.  However, my students are treading through the new waters of Algebra, and what seems obvious to me is not always obvious to them.  After I spent hours making a fun “Solving for Y” Jeopardy game so that would could spend an hour solving equations for y with glee, we instead spent an hour of misery.  The kids were tortured by the problems that they thought were “way too hard” simply because they did not understand what they were supposed to be doing.

My mistake was that I assumed since they could solve for x in two-step equations so beautifully, that throwing a y in there would be no problem.  What I missed was that unlike students I teach in high school, these students had never solved equations with two variables before and simply did not know what to do with them.  Can you add them, subtract them, put them together?  Solve for y?  THAT is not an answer!  We are used to seeing x=12 as an answer, not y = 2x – 5.  Ohhhh….. Finally my light bulb went on.

I felt so bad.  I wasted a day of learning (for them, as I had learned a GREAT deal).  I was desperate for them to see how easy it was to solve for y, and let them get lots of practice at solving for y at the same time.  But, I had already lost a day, and some of their trust.  They did NOT like this “solving for y”.  I had messed up.

So, what do you do when you mess up and want to make it right?  Well, give them candy of course!  ; )  Thanks to an amazing brainstorming session with the wonderful, brilliant teachers on Twitter a new plan was devised.  We would solve for y in the style of “Hands On Equations” with small Solo cups, Hershey kisses, and integer counters.

I used two colors of Kisses (one for +x, one for -x), solo cups for y (sorry, no -y’s), yellow and red integer circles for the numbers, and my “Hands On Equations” equation mats.  I made a worksheet (at end) and modeled the equations with my new best friend, Elmo.  I had them model EACH equation, and write exactly what they modeled (in equation solving form) on their worksheet.  THEN, we moved on to solving without cups and kisses.

**  The BEST part of this activity was by far the cups!  **

When I had 3y = 6x + 3, I asked them, if 3 cups equals 6 Kisses and 3 chips, then how much does EACH cup (or y) have?  By using cups they could actually put 2 Kisses and 1 chip in each cup.  An unexpected plus of the cups was that the students did not once forget to divide BOTH the coefficient of x AND the constant by the coefficient of y!

Solving for Y with Kisses and Cups

Another highlight of the activity was the last problem.  It came down to 4y = x + 4.  I was so excited to see the students realize that each cup got 1/4 of a Kiss!  They discovered that they had to split the Kiss into fourths to put an equal amount of Kiss into each cup.  So, the answer was y = (1/4)x + 1.   My HS students in the past have always had trouble extracting the slope when they come up with y = x/4 +1.  I am really hoping Kisses help them greatly with this!  We will see this week as we delve into finding slope!  : )

My favorite part of the whole day was hearing kids say, “Wow, this is so easy!”.  Their favorite part was eating the 6 Kisses I allotted per student at the end of class.

Solving For Y with Cups and Kisses Activity Sheet

Fractions in Action…Free-Throw Fractions!

I am used to teaching precalculus, not fractions.  I was not really looking forward to teaching fractions to my 6th graders this year.  In the high school setting, most students have severe adverse reactions to fractions.  So, I decided that I had to do something FUN to save everyone’s sanity.  I wanted an activity where they would want (or at least get) to practice tons of operations on fractions.  Luckily, I am at a project based school and they highly encourage “thinking outside of the box”.  So, I decided to take them “outside”!

We met outside on the basketball court, and each student could volunteer to shoot free-throws.  They drew to see if they would throw 6, 8, or 10 shots.  Then, we kept track of their shots on the “Free Throw Stats Sheet”.

FreeThrowFractions

After all of the kids had gone, we sat down at the picnic tables and …

  1. Wrote the fraction “shots made / shots attempted”.
  2. Simplified the fraction
  3. Wrote the simplified fraction as a decimal (dividing by hand)
  4. Found what our shot percentages were (decimal x 100).
  5. Found the LCM of all shots attempted.
  6. Wrote equivalent fractions using the LCM.
  7. Compared all players using the equivalent fractions.
  8. Compared ourselves to our local college basketball teams.

After the first 4 steps, I had them just look at the players and estimate the top five shooters.  Then, after we did the equivalent fractions, we actually ordered all of the players to see how close our estimates were.  With the number of shots that we took, the kids were pretty accurate in their estimates before making the fractions equivalent.  Ah, if I only had more class time in a day!

Back in the classroom the next day we compared ourselves to the local college team.  The GREAT thing was that the percentages were listed in decimal form!  That was such a bonus for me and really made them think about it more.  (ie – The highest women’s free throw percentage was 0.806 – what is this percentage?  Not 8.06 or 806 but 80.6 % – ahhh!!!)

Davidson College Women's Basketball

Davidson College Women’s Basketball Stats

Davidson College Men's Basketball Stats

Davidson College Men’s Basketball Stats

Instead of all around groans when we did fractions, the kids seemed to really enjoy it.  As we were shooting, the kids were doing much of the math in their heads and then saying things like, “I’m at 100%!” or  “Two out of four – I’m at 50%. Hey!  I’m as good as Shaq!!”  Plus, sometimes it is just great to get outside on a beautiful fall day!  : )

As always, suggestions welcome for improvement of this activity for next year!