I get this question a lot. My honest answer, “I don’t know, I just do.” Most of my teaching friends in the MathTwitterBlogosphere do as
much or more than me. It’s just what we do.
I teach full time and have three boys in competitive sports. My husband works as much, if not more, than I do. We share the workload. He is laundry, I am groceries, etc. It’s not easy, but it works. And anything worth it is usually not easy.
The past month has been the most hectic I can remember in a long time. I’ve been out of town 18 of the last 24 days and I still have one more 3 day trip this week. I have interviewed for jobs, went to NCTM in New Orleans, went out of town for a week at spring break, and went on a three day overnight with the 7th grade. I just got back today from a weekend soccer tournament with my youngest son in VA. This week I go to the Smoky Mountains for three days on the 6th grade overnight. This month has been insane even for me!
I blog and tweet because I love it. It’s my passion. I don’t read books for pleasure unless I’m on vacation. I rarely watch TV. I make time for my family, teaching, and the MTBoS because they are all things that I love. Being busy keeps me happy.
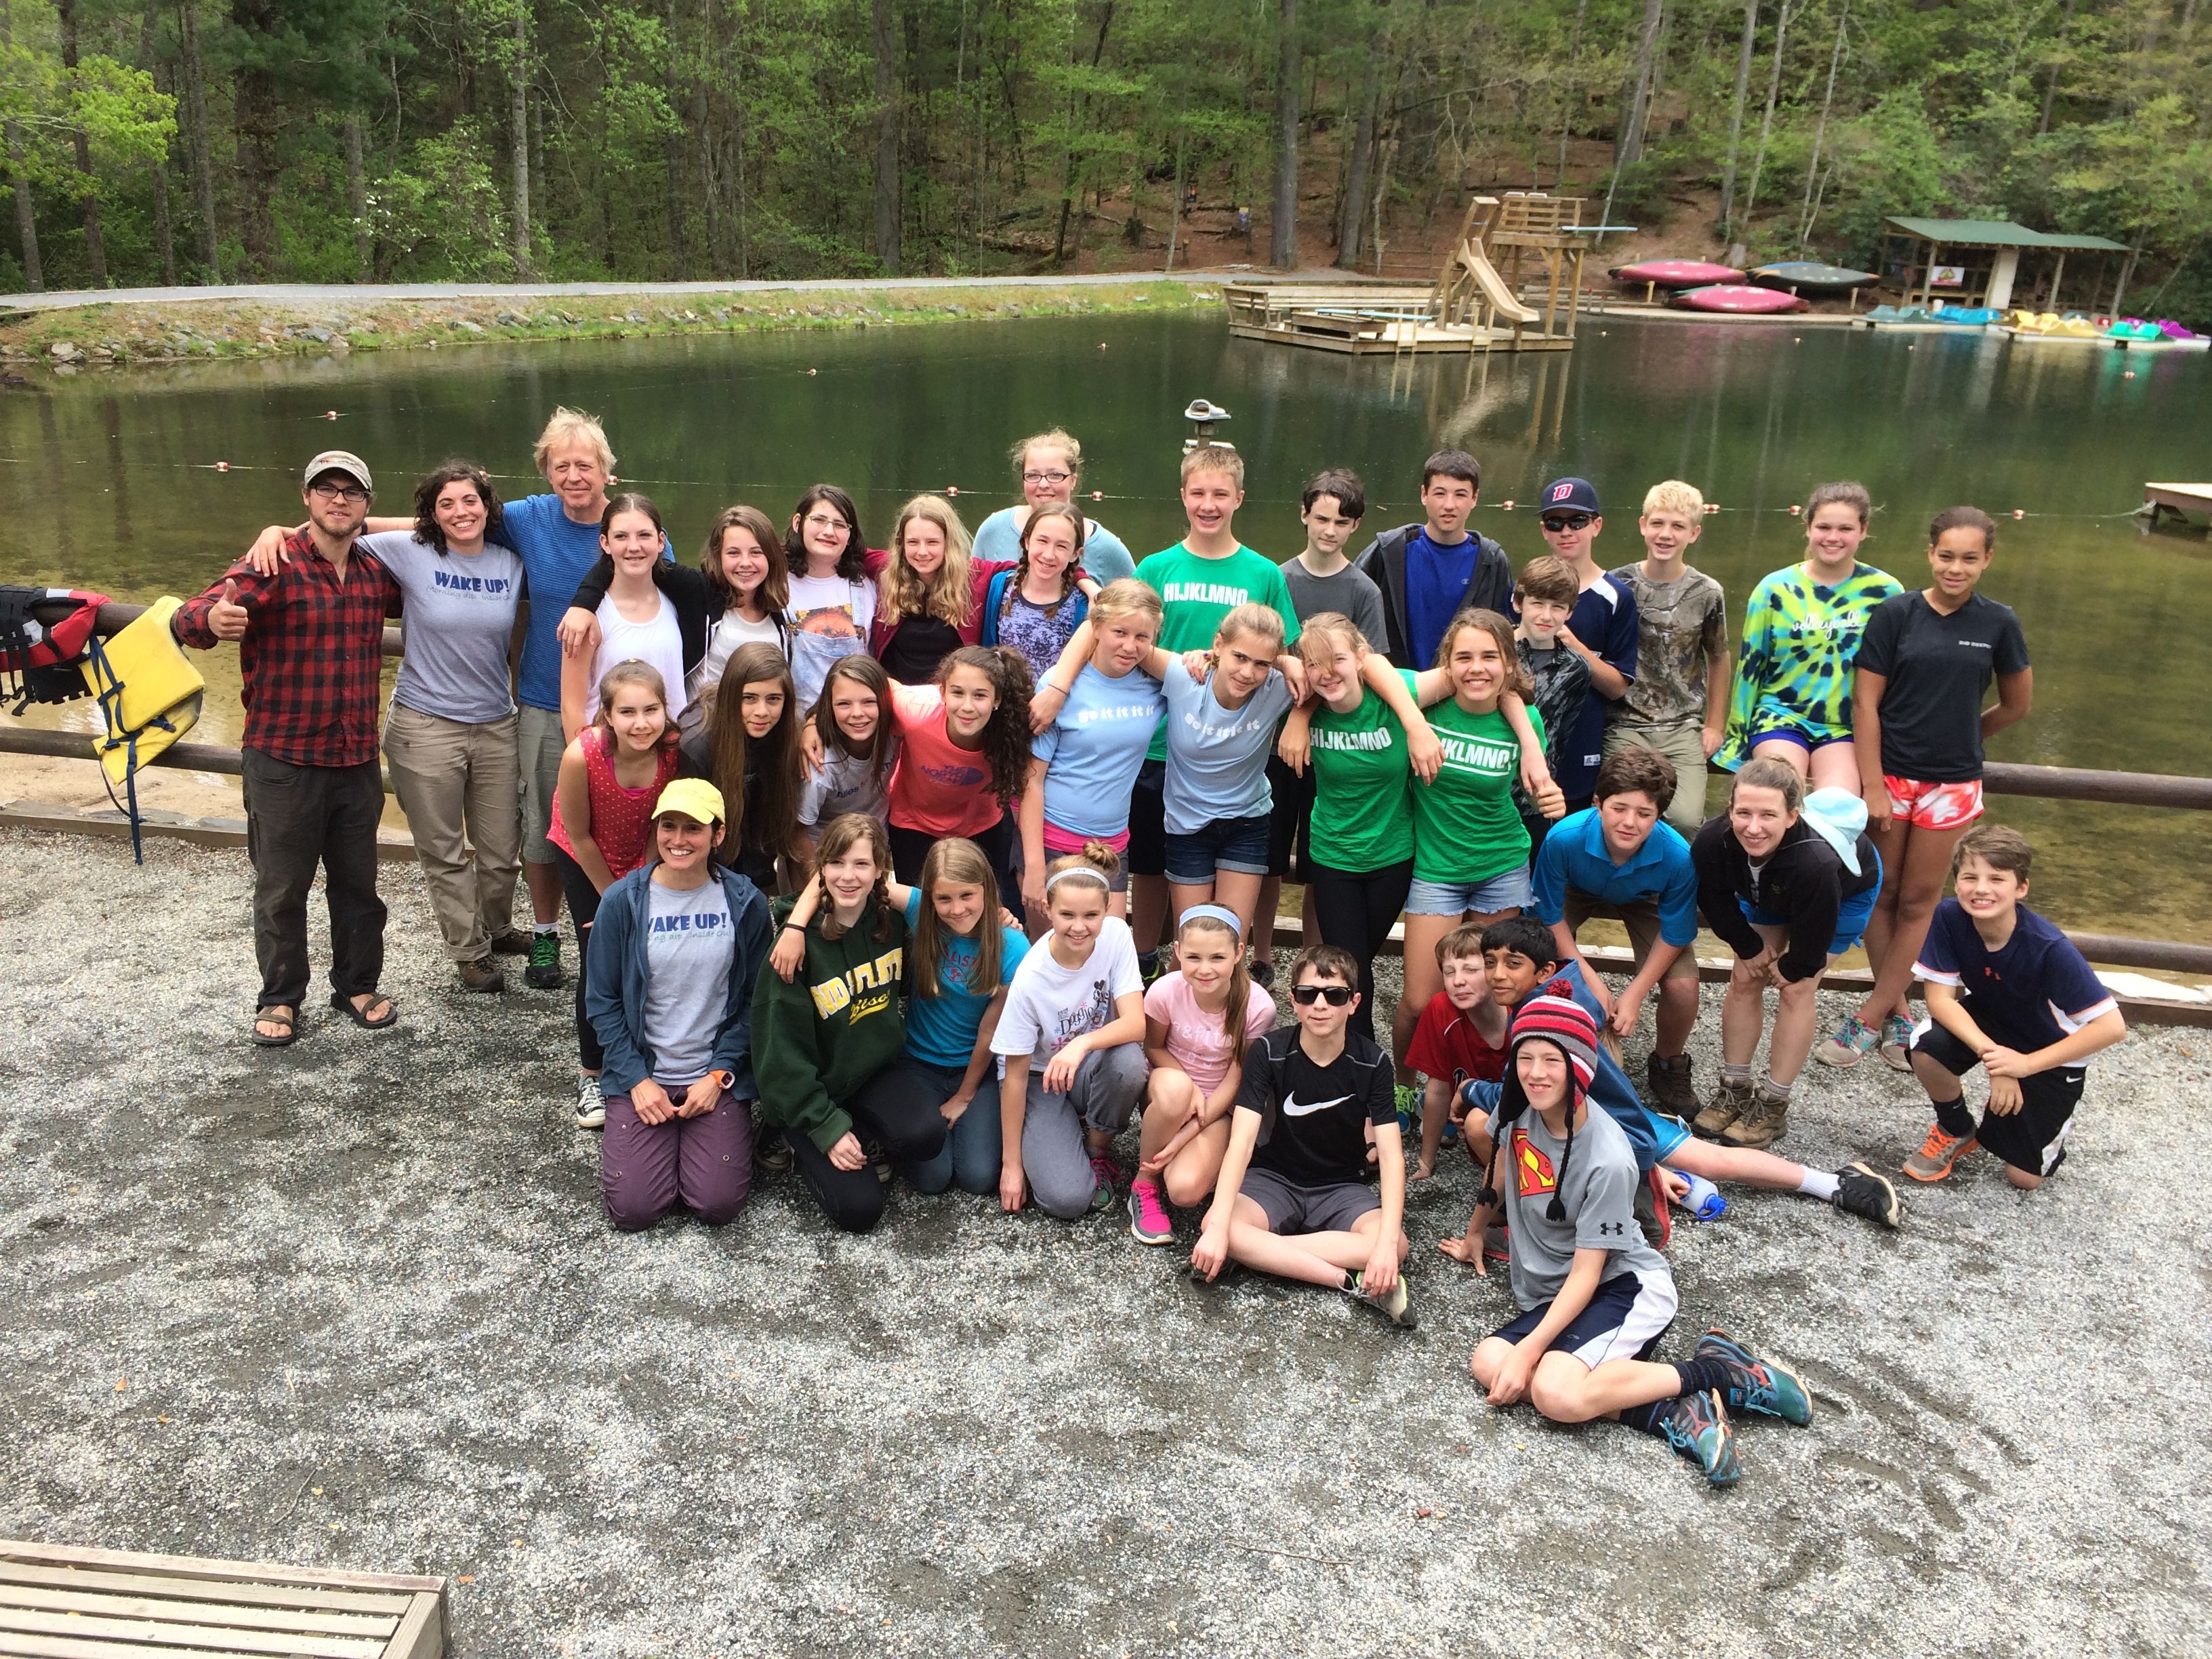
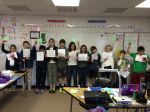
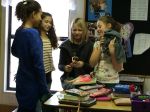
Last week I went on the three day 7th grade overnight trip in the mountains of North Carolina. It was ran by Inside Out at Camp Tekoa. I’m not sure what you do for your middle school trips, but this was an amazing adventure! Inside Out does a fabulous job with the students. Our focus for this year was team building. We learned about water quality, caught stream critters with nets, hiked to waterfalls, rode the rapids, went rock climbing, built rafts, and played tons of games.
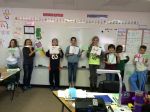
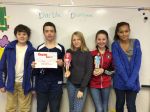
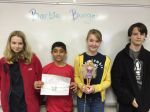
7th Grade Woodlawn Students with Inside Out Counselors
The water was pretty chilly (60 degrees), but that didn’t stop us! I even jumped in the rapids with the students. We also did the “Morning Dip”. This is where anyone that wanted to could start their day by jumping in the lake at 7:15 am. We all lined up on the dock and screamed, “WAKE UP!”, then jumped in together.
The Inside Out counselors were fabulous. I have recommended that we extend our trip to four days for next year. The students loved it and said they wished they could have stayed all week! I have taught these students for two years so going on this trip was very special for me. I cried when we had to leave on the last day.
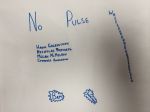
Thank you Monica, Nicco, Emily, Jessie, Star and Wally for a life changing experience.
I spend two days with my students discovering volume. I do this because the volume formulas LOOK horrendous, however they make perfect sense. I like for my students to discover these formulas, because then they do not think of them as formulas. It just makes sense.
The first day I do volume of prisms, rectangular, triangular, and a cylinder using play-doh. The next day I do cones and pyramids. A few years ago I had a project where students made cones that fit into cylinders perfectly. I still use these models as they are such a great visual for students.
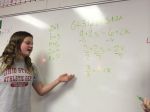
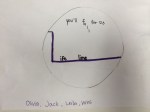
I start by showing them a cylinder, and having a student write the volume formula on the board. I have not asked them to memorize the volume formula of a cylinder, but after day 1, they all know it. It’s magical. I then pull a cone out of the cylinder and ask them what they notice and wonder. They notice that the circle has the same circumference and the height is the same. Excellent. I then ask them what they wonder about the volume of the two objects. Most groups decide that it is about 1/2, except for this group.
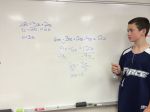
I then let them pour cheerios (or marshmallows) from the cone into the cylinder. They notice it takes THREE cones to fill up the cylinder. I have them talk with their table to adjust the volume of a cylinder. Today, ALL of my students said, “Divide the volume of a cylinder by 3!” and one group even told me that was the same as multiplying by 1/3.
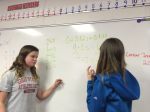
After I write their observations on the board, I show them the actual formulas from their Geometry Booklets and ask them to write down what they learned today on that page. I think this is the most important part because I don’t want them to forget HOW they discovered the formula. Today a student said, “We just invented already invented math!” It was so awesome I had to film it, of course.
Now that is a magical day in math. Please, please, please do discovery learning with your students. It does take more time but will actually will save you more time in the end because you won’t have to re-teach it!
Join the Math Twitter Blogosphere for the 30 day blogging challenge! Thanks Anne for the challenge and the inspiration! My blogging always takes a nose dive in the spring. I have had much professional turmoil this year so this spring has been even worse than usual.
I really miss blogging so I’m very excited to take this challenge and blog once a day, just for 30 days. These posts do not have to be long or even about curriculum. They can be a short story or even just a picture of something you are doing in your class that day. The fun is in participating! I will be out of town for almost a week this month on class trips with no access to the internet, so I know I can’t do everyday. However, I am going to try to do everyday that I can. You should join us – it’s going to be a blast!
If you do decided to join, please tweet out your posts with the #MTBoS30 hashtag. Welcome to the fun!
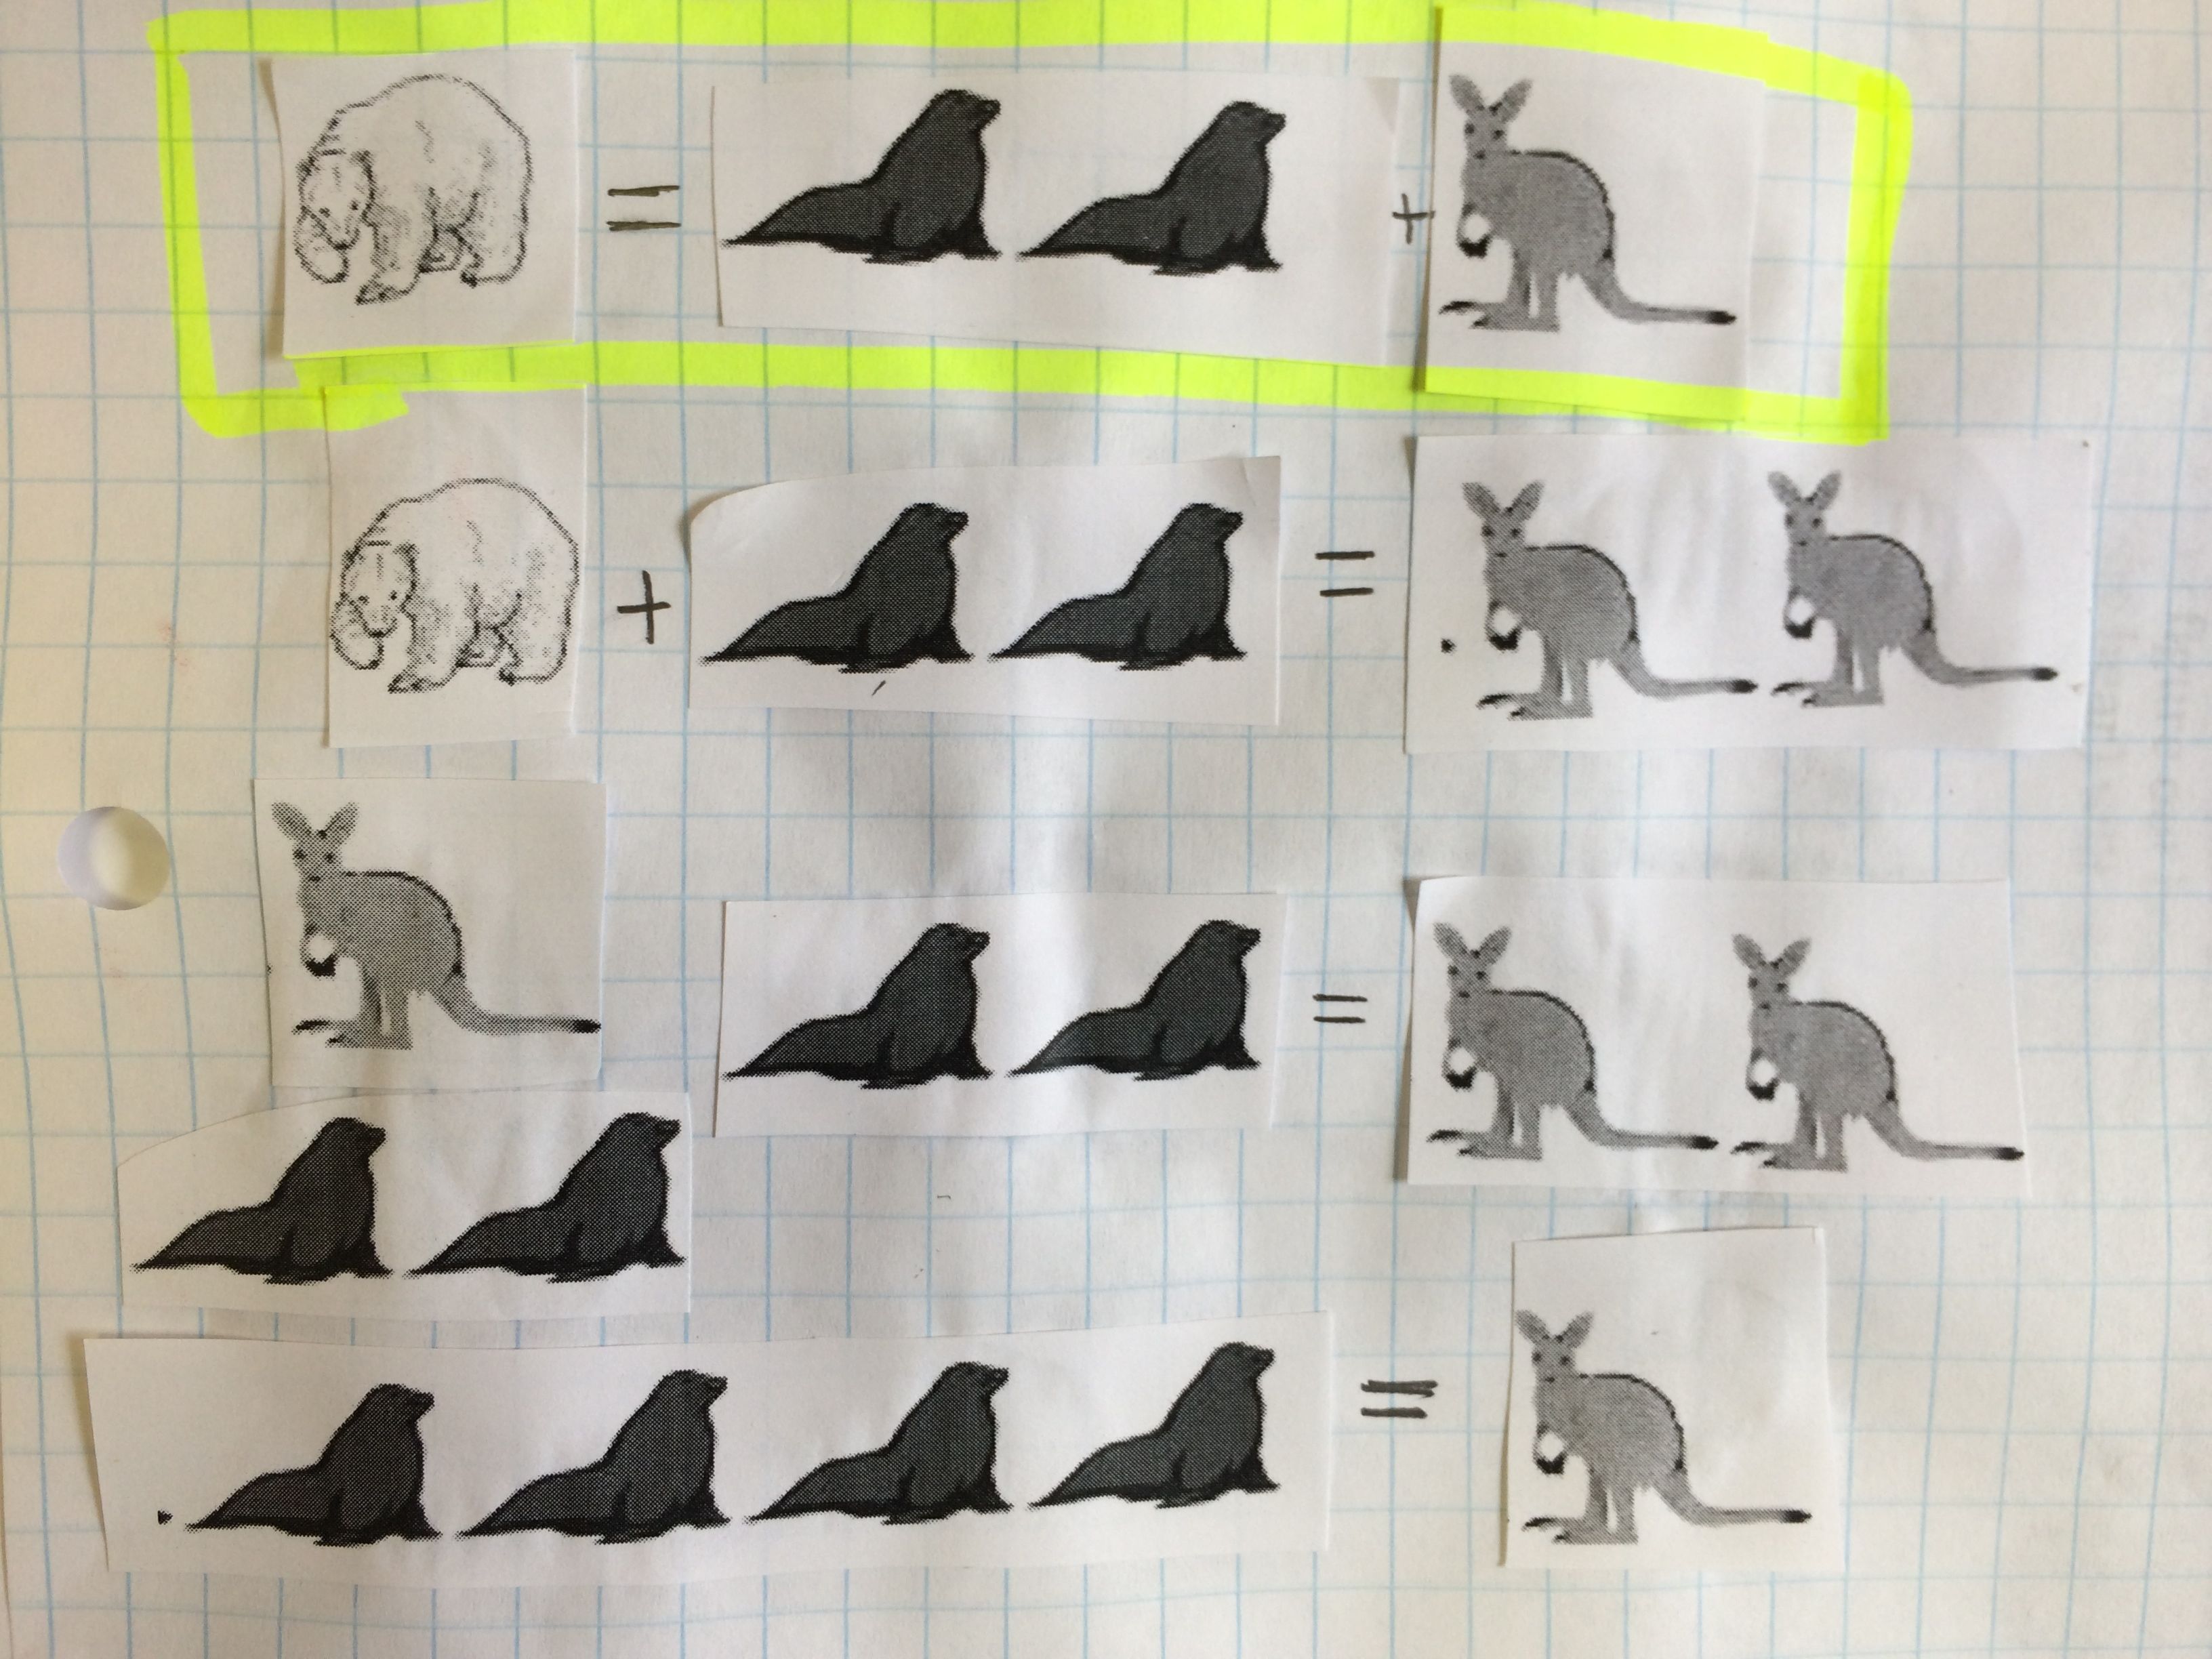
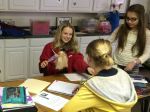
“I feel so accomplished!” is what I overheard a student say after doing the Noah’s Ark problem solving activity in my class today. I also heard, “You will REALLY like math class today! It was so hard, but so much fun!”
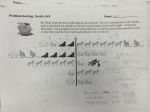
Give them all their own copy of the problem. (And a sheet of animals to cut out if they wanted it). Noah’s Arc PS
Let them read it silently
Let one of them read it aloud while other students read along silently.
Let them work silently for a few minutes.
Let them work together.
Discuss solutions.
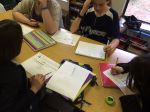
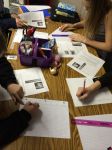
While working silently, many students came up with a solution. However, once they started working with others, they realized that their solutions may not be correct. I loved how they were explaining their solutions to their classmates, and their classmates would say, “Oh, but then you would have too many zebras.” and I would hear the, “Ohhhhh…” My favorite had to be “But WHAT is kangaroo? WHAT ARE YOU?” Several students asked for another copy because they had written all over theirs and wanted to start again.
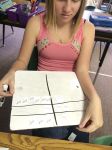
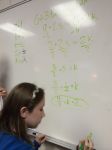
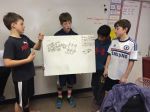
Giant Whiteboards are great for group work and presenting.
Working together.
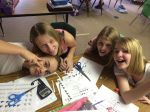
They loved the animals cut-outs.
Rebuilding the problem.
“I can’t stop until I figure this out!”
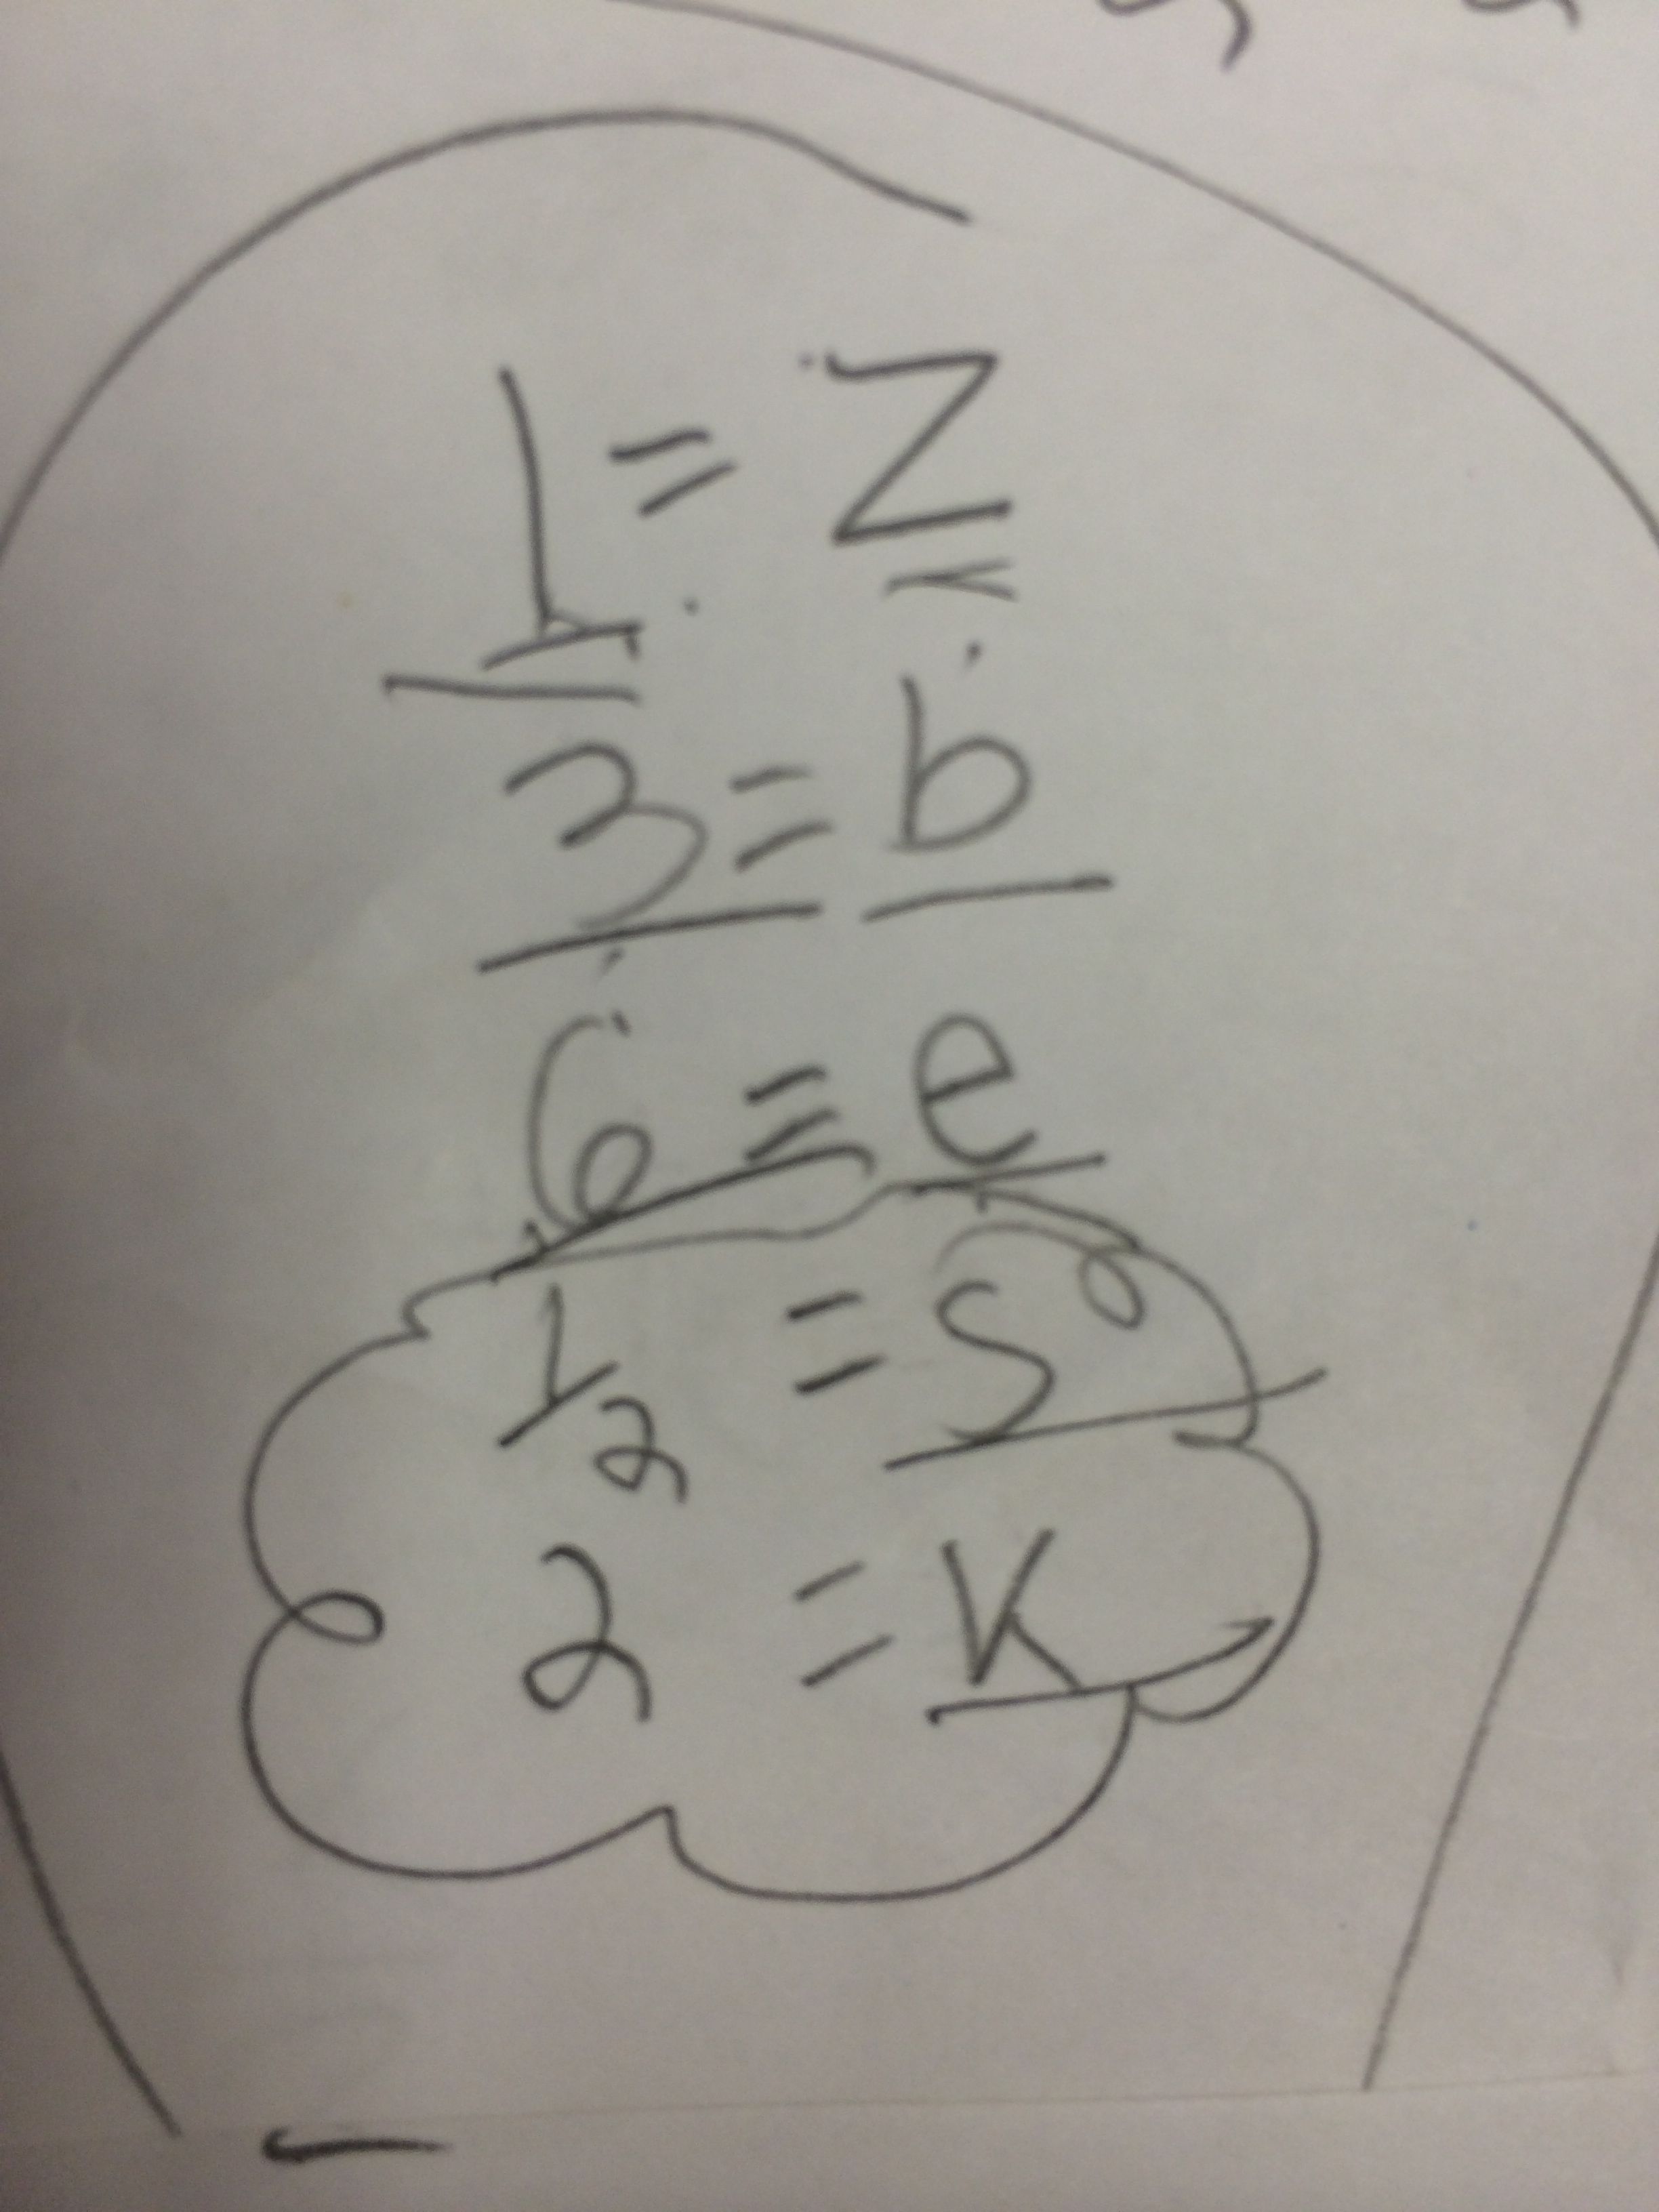
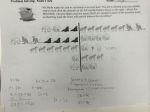
Some students let the animals equal animal values.
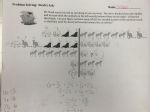
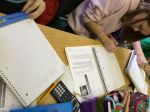
Most students had to work together to come up with the correct solution. A cluster of my students decided to assign point values to some of the animals, and variables for others.
This was an altered version of substitution, and so interesting for me to see. I loved how they molded the problem to fit their level of understanding. Their minds work in fascinating ways!
Student Solutions:
Here the animal cut-outs are used to visually show the substitution. This was helpful for the students who were not convinced by the algebraic solution.
I got this amazing idea from Bruno Reddy, @MrReddyMaths. Go and read his post here. I love his discussion about mean and deciding who should win! When I saw his post I knew it would be fun. I planned on using the data to calculate mean, median, and mode. However, I did not realize how much mileage I would get out of this one activity! I pretty much teach the entire data chapter using just the data from this one activity.
I have my students watch the “How to Make a Paper Airplane” video and give them the template. I do not give them any instructions and do not allow them to help each other. Following directions is always a skill I am trying to teach 6th graders.
After we make the airplanes, we get to fly them! Of course, I make it a competition. And of course, I video it!
Everyone gets a partner, to help with measuring, and three attempts at the best flight! Student’s whose planes fly backward get to record NEGATIVE flights. All three flights are recorded and then entered into a Google Form. For homework that night, they had to find the mean of their three flights.
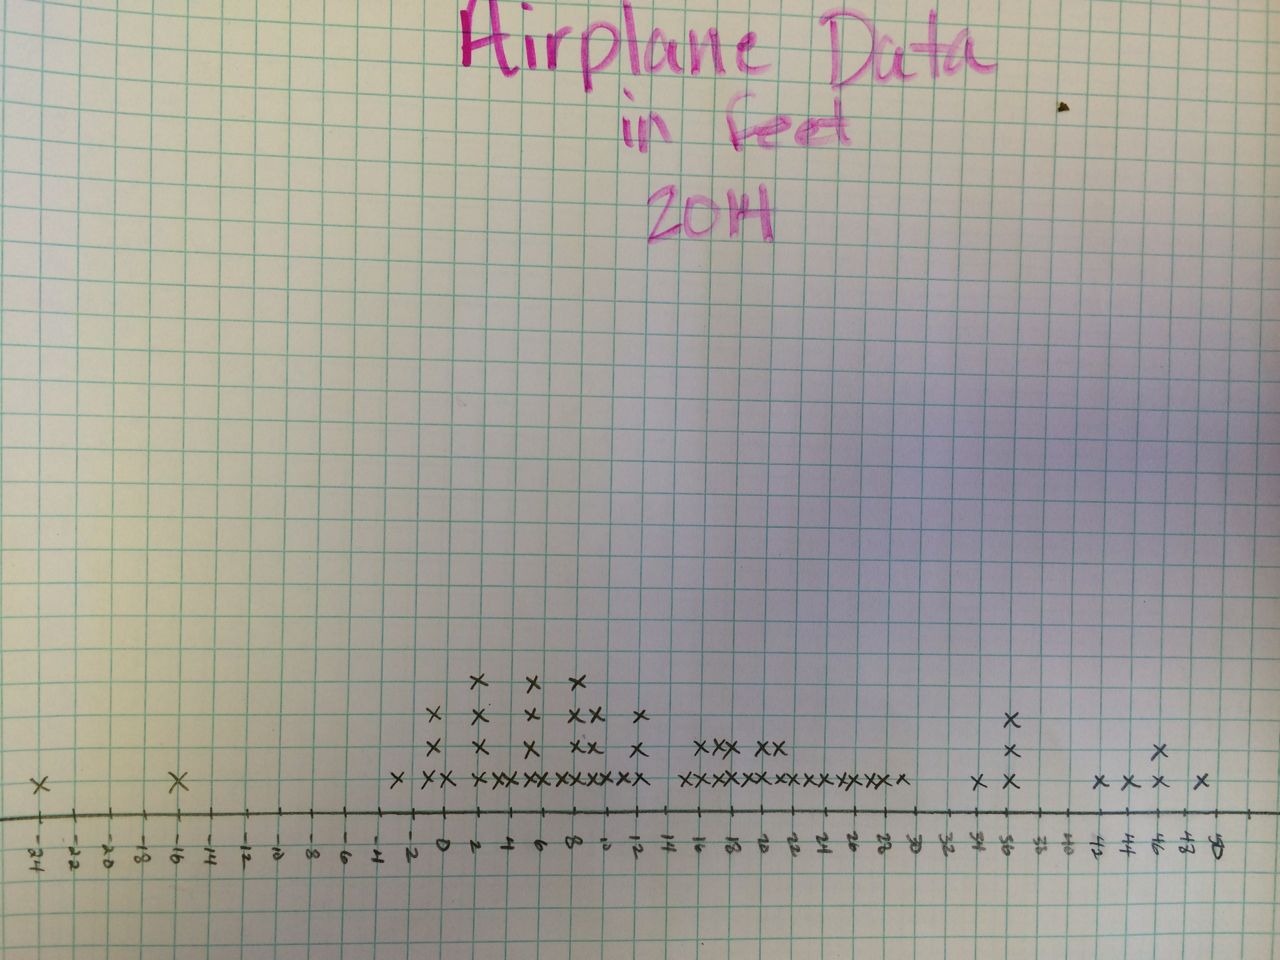
Line Plots and Scale:
I have students make a line plot out of all three entries. This year, I only had 21 students, so this is 63 entries. This is a great time to talk about scale. I have them record their distances in inches, but then they quickly realize that it is a much better idea to make the line plot using feet. We find the mean, median, and mode of our data using our line plot.
Range:
Range is one of my favorites here, especially with the inclusion of the negative flights. This year, our flights ranged from about -300″ to 600″. Predictably, almost all students told me that the range was 300″. Students love plugging values into formulas incorrectly. To help correct this misunderstanding, I had my -300″ flight student and my 600″ flight student come to the front of the room. I stood at the starting point (the edge of the blacktop for us, also known as 0) and had them stand where their respective planes had landed. Students immediately not only saw that 300″ was way off, but they saw why. This was a wonderful opportunity to show them that 600 – (-300) was indeed 900″, not 300″. My analogy to help deepen understanding was, “You leave from Charlotte to fly to New York, but you have a layover in Atlanta first”! Nothing is ever better than visual learning and real life examples.
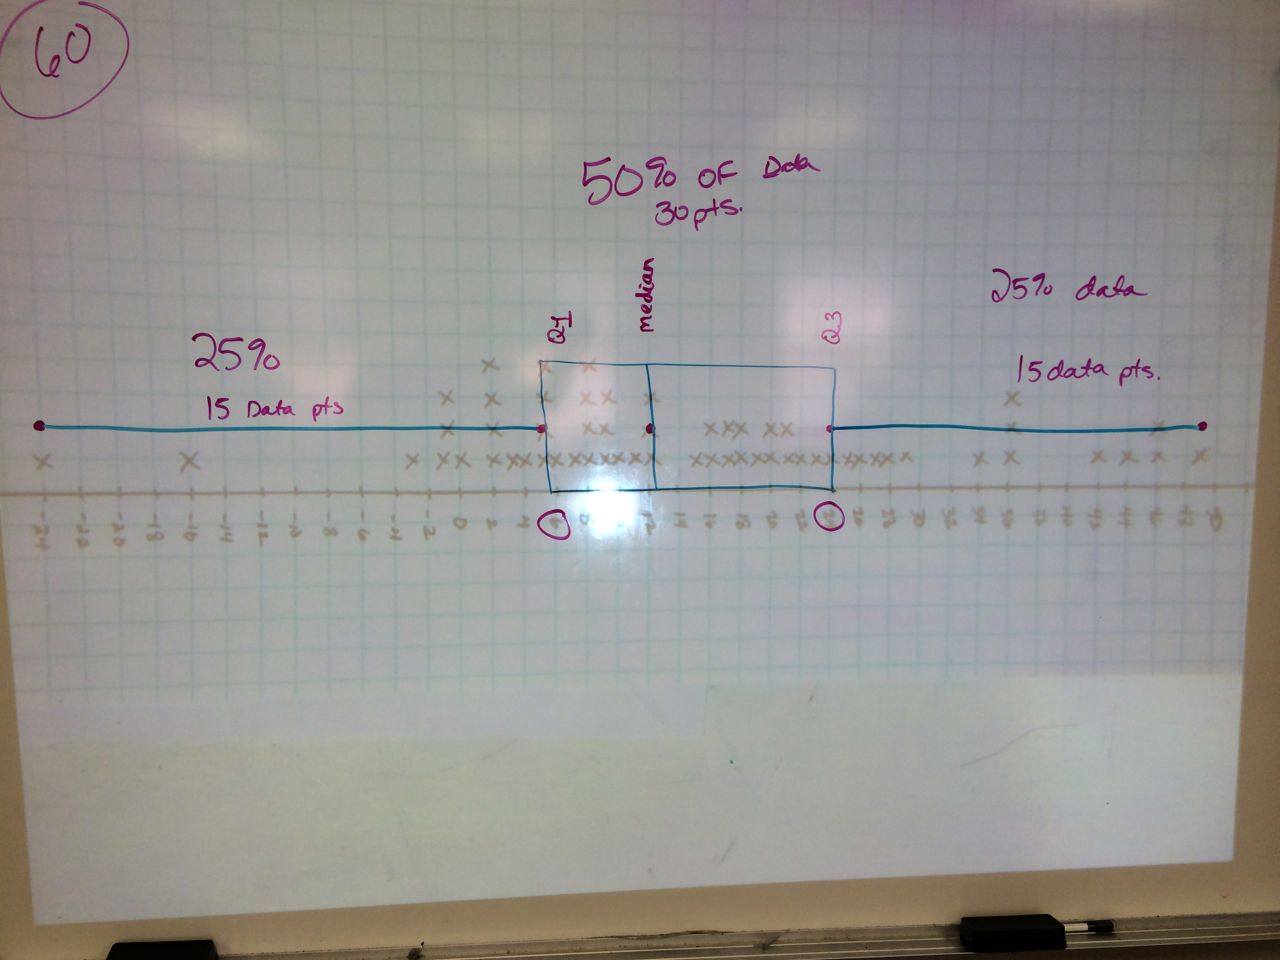
Box Plots:
The next day we learned about box plots. I project the line plot of our flight data and as a class we make it into a box plot. They loved seeing that a box plot can helpfully catagorize their data. Outliers are visual here, as well as where 50% of their flights landed. Next year I am going to take a picture of their airplanes laying on the blacktop to back this statistic up visually.
I also had the students create a box plot of their mean flight data. They wrote their mean flight length (in feet) on a sheet of 8×11.5 paper. Then, they organized themselves into a human box and whiskers plot. The students who were the lower and upper extremes, Q1, Q3, and median all held index cards with the name on them. We also decided who was in our interquartile range.
Histograms:
The line plot looks very much like a bar graph. After a very brief explanation about histograms, we turn our line graph into a histogram. The students love seeing their data grouped and of course ask why we didn’t do this in the FIRST place instead of making the tedious line plot. It’s all for the sake of learning. (Insert evil teacher smile.)
Google Doc Data:
I shared the data with the students and we then all made bar graphs and histograms on Google Spreadsheets. The students like the histograms better as it condensed the data into groups. They also learned how to sort the data and find the mean using a formula. Again, they love finding the mean using spreadsheet formulas, find it less “mean” than calculating it by hand, and call me a “mean” teacher for not showing them this in the first place! Practice makes perfect.
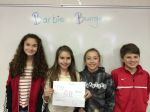
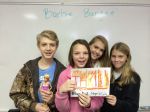
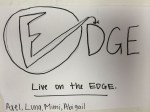
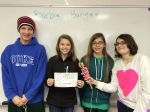
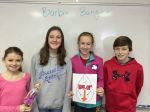
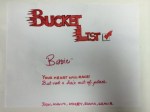
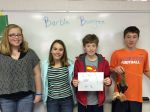
What a difference a year makes! My current students saw all of the Barbie Bungee action from the sidelines as 6th graders last year. They have been asking me ALL YEAR LONG when we were going to do Barbie Bungee. This build up was terrific! Once they knew Barbie Bungee had arrived, they were begging for math class.
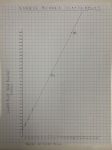
After all of the build up, my students took Barbie Bungee very seriously this year. I make it a competition, and they all wanted to WIN. They did multiple test drops, they measured carefully, and they drew beautiful graphs. I did not teach them about the line of best fit, but had them read about it here instead. I told them whoever had the most accurate data and the best line would win the competition! They were inspired to learn all about the line of best fit!
Again, I let them adjust their graph after the 90″ test jumps. This year I was tougher on them, and would not let them test jump again until they fixed their graphs.
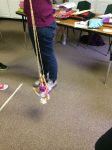
The big jump day was so exciting! Students were yelling and screaming. One group had a rubber band disagreement. They calculated the number of rubber bands and wanted to put a half of a rubber band on so their estimate would be perfect. They wanted to win. However, we don’t do half rubber bands, so the great rubber band debate ensued. They only agreed to put the last rubber band on seconds before the jump. It was a deadly mistake, and their Barbie was the only one to crash. It was a tragic (read great) learning lesson!
Please enjoy the pictures and the video. I have so much fun with this project and making the video each year. It is the best project I have ever done with my students!
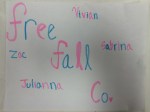
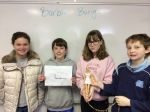
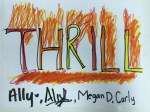
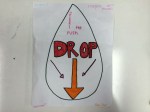
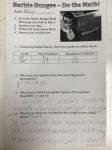
Group students and have them come up with a company name, slogan, goals, and logo for their Barbie Bungee company. Have them read about the line of best fit for homework.
Day 2
Give students the handout and let them do the test jumps and the graph.
Day 3
TEST DROP day from 90″. Students adjust their graphs if needed, and get to add a data point to their graph and adjust their line of best fit if needed.
Re-drop if needed once graph is completed.
Estimate how many rubber bands they will need to drop from 160″ and then attach those rubber bands to Barbie.
Day 4
JUMP DAY – Finish putting rubber bands on Barbie and then JUMP!
Don’t miss Global Math this Tuesday night, March 4th, Student Creativity in Math with Technology. Rafranz Davis (@rafranzdavis) will be presenting.
Rafranz is an instructional technology specialist for a Dallas/Fort Worth area school district. As an advocate for passion-based learning, Rafranz uses her experience as a secondary math educator to help teachers integrate technology using innovative teaching strategies aimed at empowering students to be autonomous learners.
I was honored to be interviewed for the launch episode of the new MathEd Out Podcast. I was also nervous, so I talked a bit fast. But, fast forward is pretty much my constant speed!
We are excited to announce the launch episode of the MathEd Out Podcast, a show for those wanting to hear about the best ideas and resources in the world of Math Education.
Guest appearance from Blogger Julie Reulbach of ispeakmath.org fame
This week we are joined by influential blogger Julie Reulbach from ispeakmath.org who will be sharing about why she started to blog and how much it has benefitted her in the classroom. We will also have tips for those who want to start their own.
Julie is a middle school teacher from North Carolina and is a regular on the bloggerstwittersphere (@jreulbach)
YES, it is free. You have to pay for your airfare and accommodations only.
NO, you do not have to be on Twitter, or have a blog, to attend. It is for all passionate math educators around the world!
It was planned by two amazing math teachers, Lisa Henry and Shelli Temple, so that math educators around the country could come together, share our favorite resources, and develop new ideas for the coming year.
The conference is called Twitter Math Camp. (The founding educators were colleagues on Twitter.) However, it is open to all math teachers and will cover topics from middle school math to Calculus. These are amazing teachers on the cutting edge of education and technology. What I love the most about this conference is that it is totally BY math teachers, FOR math teachers. It’s going to be an amazing four days.


 I then let them pour cheerios (or marshmallows) from the cone into the cylinder. They notice it takes THREE cones to fill up the cylinder. I have them talk with their table to adjust the volume of a cylinder. Today, ALL of my students said, “Divide the volume of a cylinder by 3!” and one group even told me that was the same as multiplying by 1/3.


 Guest appearance from Blogger Julie Reulbach of ispeakmath.org fame