I can’t say it enough. Begin at the end. This is not how I learned when I was in school. This is not how I used to teach (as recently as a couple of years ago even). And this is still not how I always teach. But, it is how I want and NEED to teach, every time. I’ve been reading much about “real” and “application” problems in mathematics teaching lately. The value of these problems is that it can make a lesson engaging. Making a lesson engaging is one of the most important aspects of effective teaching. If you do not get the students engaged, it will not matter if is an amazing application problem or whether or not students believe it is real. If they are not engaged, they will not learn. If they don’t know WHY they are learning the math (be it real, imaginary, or application) they won’t be invested. If you just throw some new math lesson with a bunch of steps at them, they won’t care about it. Sure, your good students will learn the steps, and they will even be able to regurgitate them back to you on the test. But, they probably won’t care or remember it for long. They won’t be fascinated, and they won’t like math. Call me crazy, but as much as possible, I’M DOING THE MATH LAST these days. And I am getting audible “Ah!” moments in class – from 7th graders! As Ellie said in class on this day, “We just made math-a-magic!”
Enter linear inequalities. For me, there is almost nothing worse than teaching graphing linear inequalities. Even when students can graph, the test point alludes them, no matter how many times or how many ways I explain it. It seems like such an abstract and foreign concept to them, especially at first. Until now. Thanks so much to Misty Carver for all of her ideas and links!
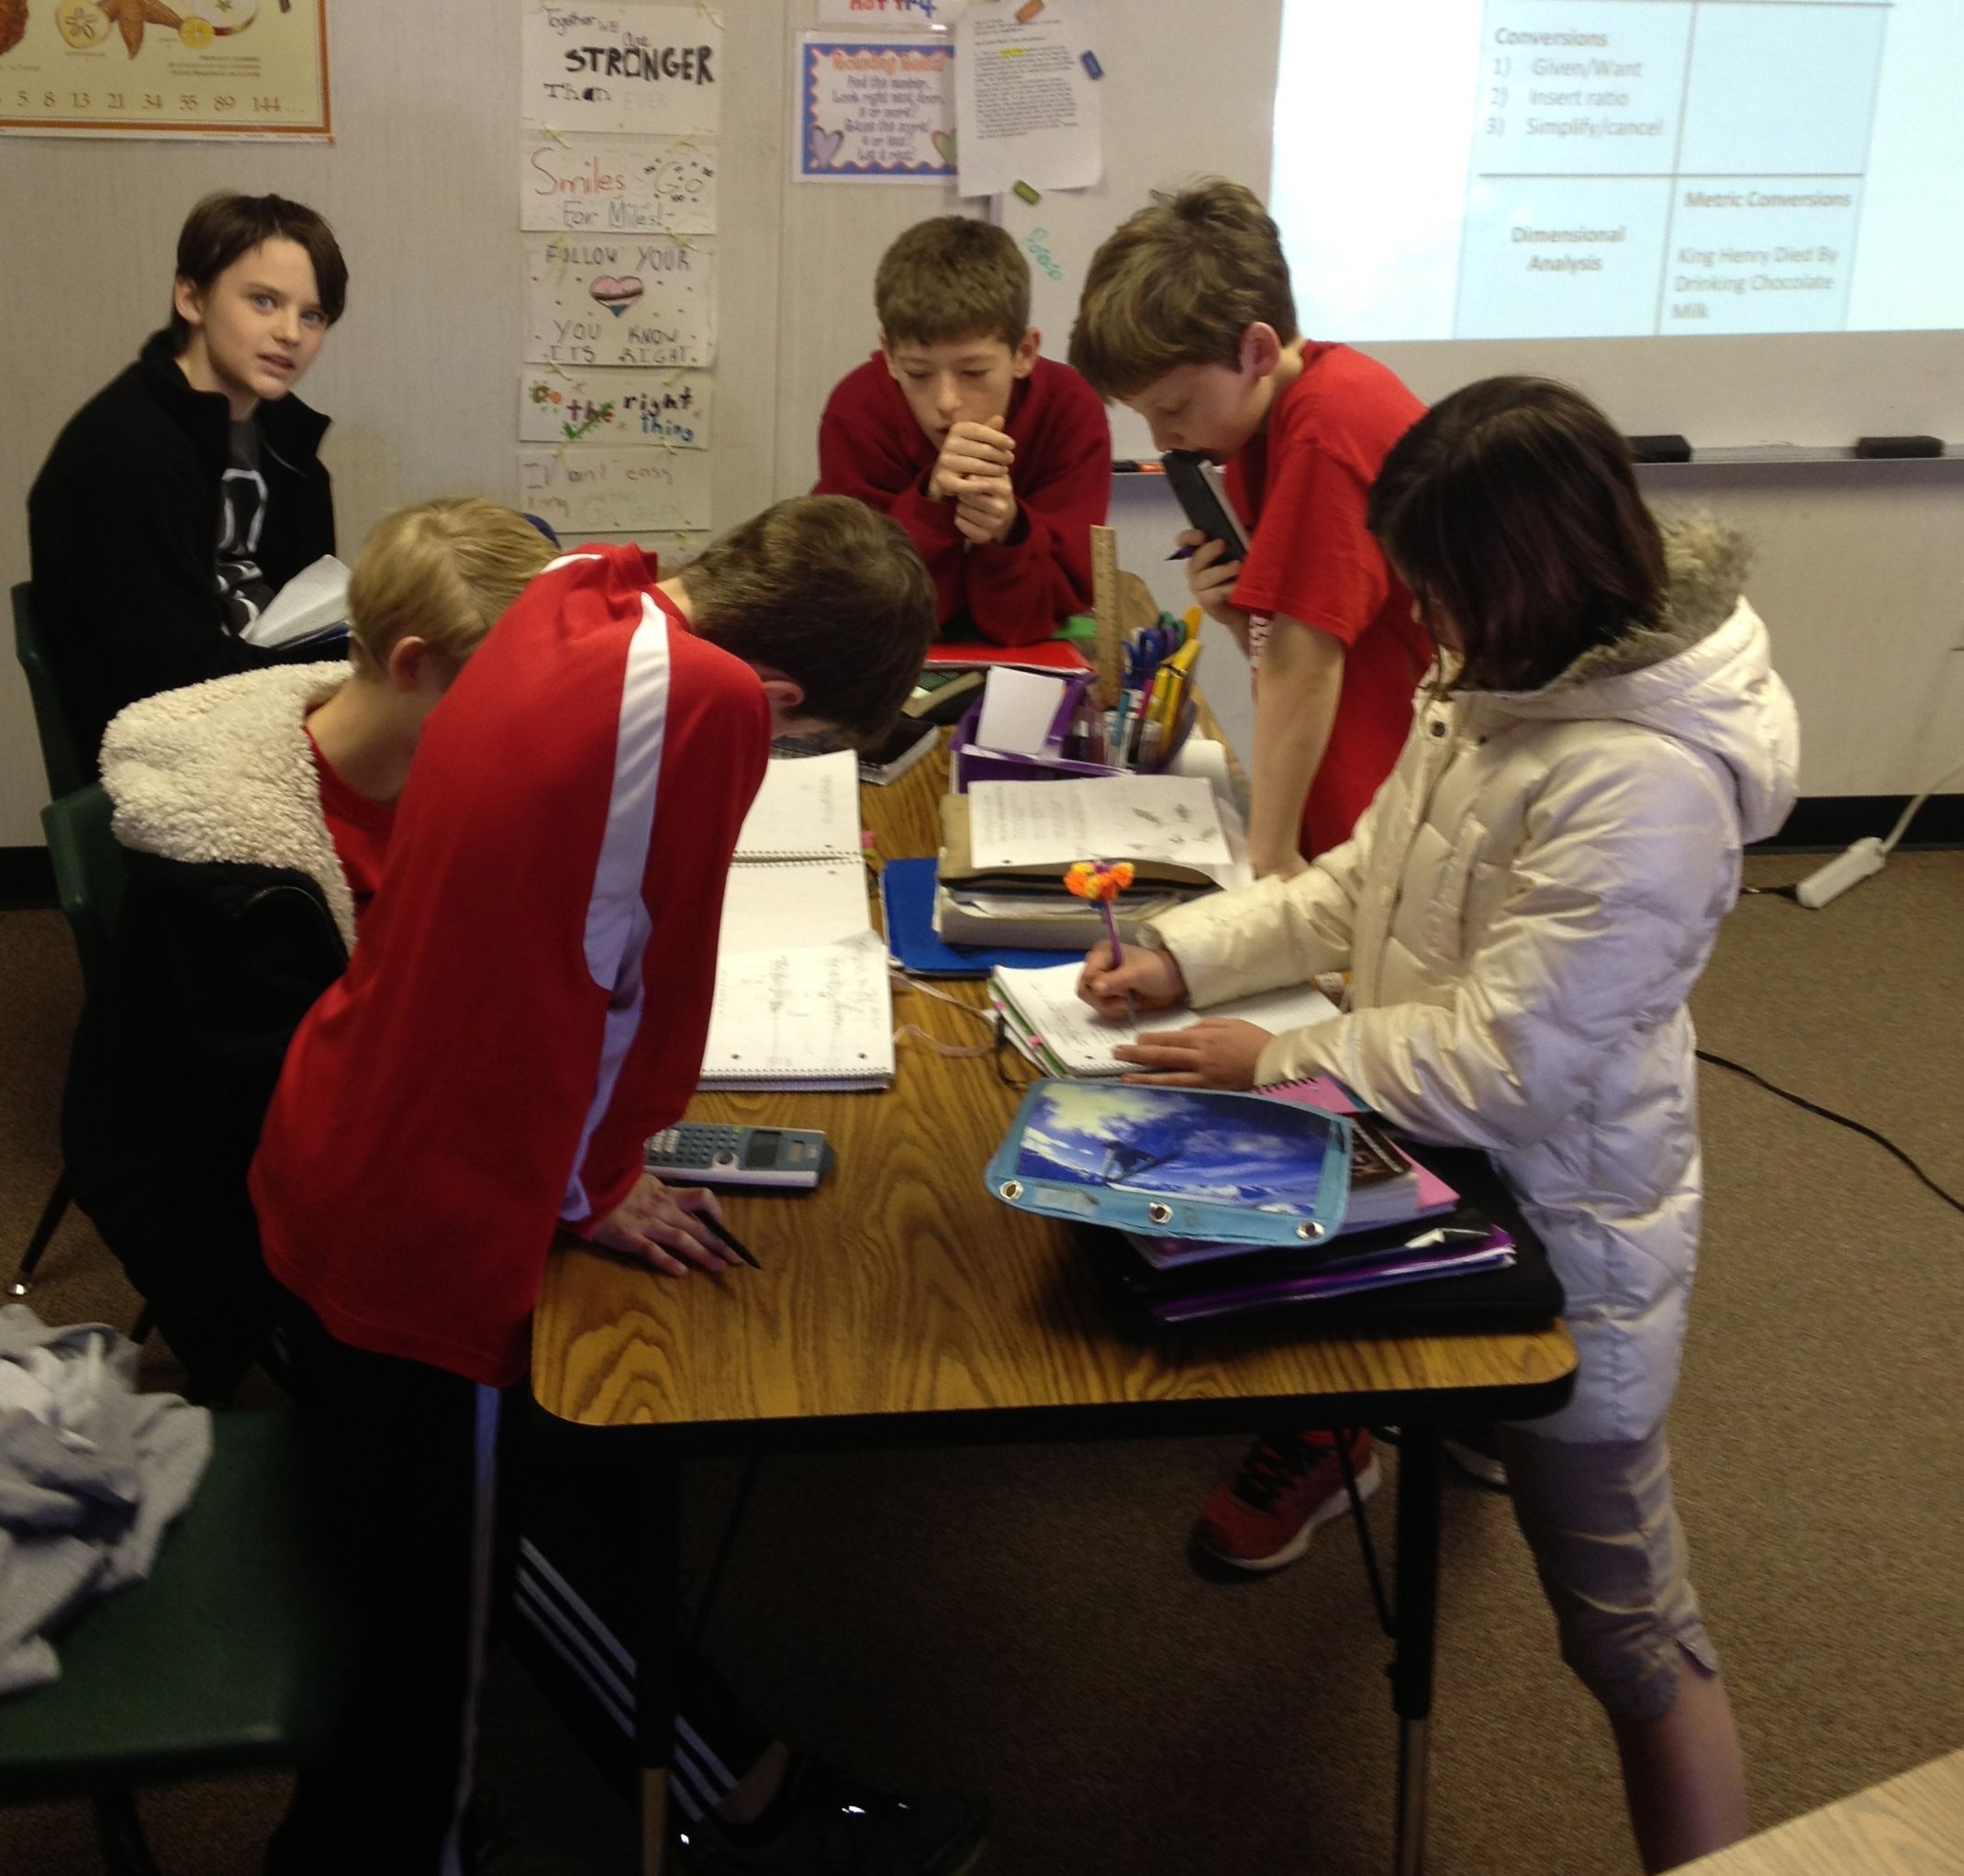
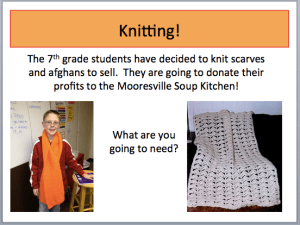
Our 7th grade students knit scarves for patrons of the Mooresville Soup Kitchen every year during the holidays. To begin linear inequalities I proposed a business. Our Woodlawn students were going to knit scarves and afghans to sell, and donate the proceeds to charity.
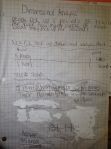
I put them in groups to brainstorm what they would need. They created lists and came up with great questions. They generated a terrific list of things they would need.
- Sale price
- Cost of materials
- How many
- Amount sold
- How much we need to sell to break even
- Knitting needles
- Cost of yarn
- Seasonal (winter – need more)
- How we are going to make (time)
- How long to make
- How many we are going to make
- How much yarn it takes to make one afghan or scarf
- Snacks!
Thanks to Google, we found out how much a skein of yarn costs, and how much yarn it takes to make an afghan (they knew how much yarn it took to make a scarf from experience). They all have knitting needles, so we were able to take that out of our expenses.
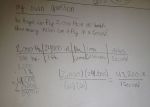
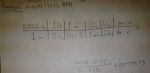
I then told them that Woodlawn school would donate $840 dollars for supplies. I had them come up with scarf and afghan combinations that they could buy for $840. I also had them come up with a combination that amounted less than $840 (in case we had unexpected expenses or wanted to buy snacks), and a combination that was too much money.
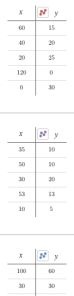
Once they had their combinations, we put them in three different tables on Desmos.com (my new favorite website!). We made a table for combinations that equaled exactly $840, one for less than $840 and one for more than $840. Desmos is an amazing tool as we were able to make each set of points a different color.
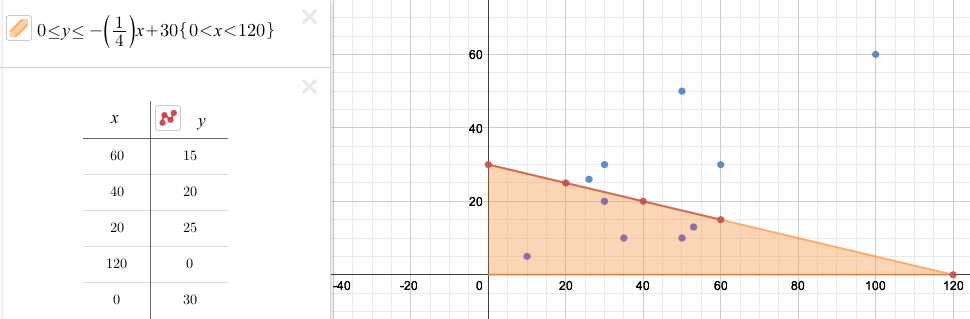
After we entered our numbers, I had the students tell me what they noticed and asked if they had any wonderings (thanks so much Max!). Thanks to Desmo’s colors, it was easy to see that all of the combinations that equaled $840 created a straight line. So, we connected this line. After connecting the line, it was very obvious that combinations under $840 all fell under this line, and those above $840 were above the line.

We wrote the equation of that line together and then I had them watch me while I changed the equals sign to the <= sign in Desmos. There was an audible gasp in the room as the bottom filled in. Students exclaimed, “Oh my goodness, EVERYTHING in the orange area works!” as it dawned on them what had happened. They couldn’t wait to see how to do it themselves and really realized what was going on.
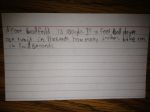
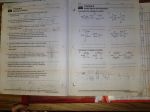
Never before had “test points” seemed so obvious to them. Test points were not just random points, they MEANT something, they told a story. The next day, when we finally got to the actually inequality lesson, foldable, and then homework, the students really understood the need for a test point. They also easily understood the horrific workbook word problem. Honestly, even I still can’t believe how well this works. It is truly, “math-a-magic”!
So please, if you can, begin at the end and save the math for last!
Thanks so much to Desmos.com for all of their help via Twitter! They are an amazing, consumer friendly product and we use it daily in our class now. I still can’t believe that it is free!