I have math club once a week and always bring them treats to eat. I’m not below bribery. So, when I saw Dan’s post I thought, “Awesome! I can feed Math Club AND make the food about math at the same time!” #Nguyen for sure.
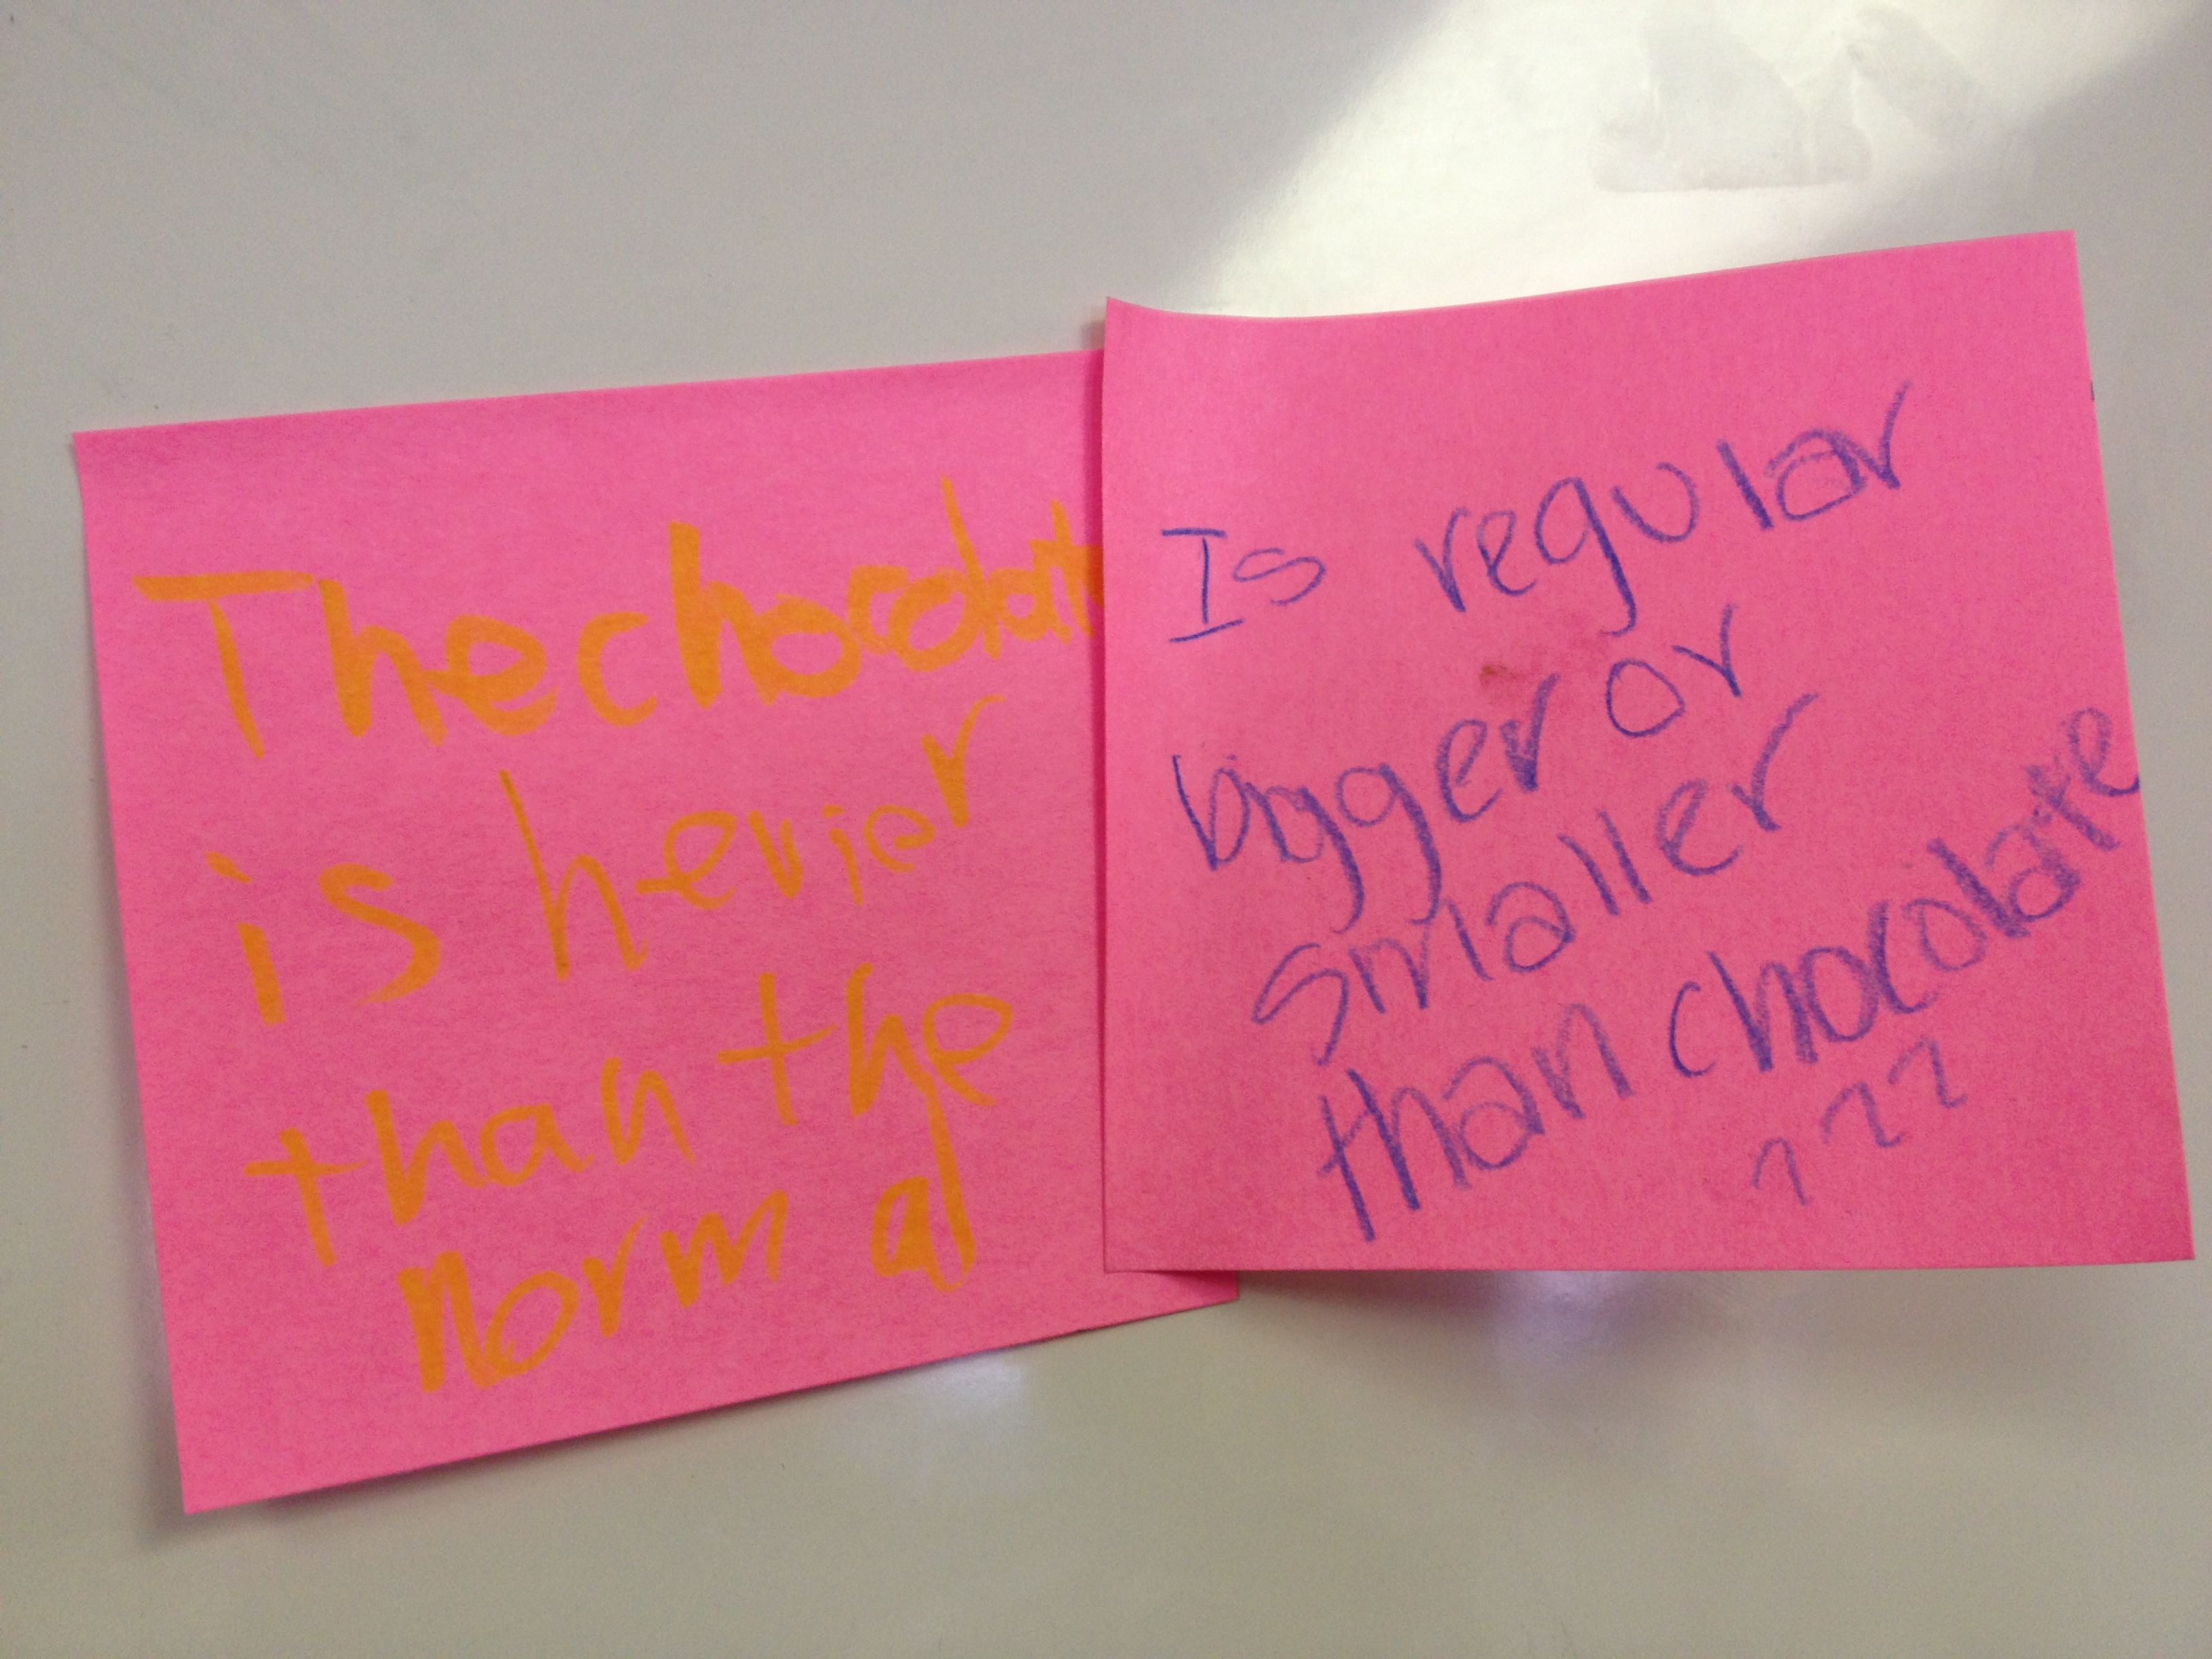
I pulled the four 4 packages of Oreo cookies I had bought to the “Oohs and ahhs!” of my math club. My 16 kids did the math in their heads instantly, calculating how many Oreos each of them were going to get to eat today. I opened the packages and pulled one out from each, original, double stuffed, chocolate, and triple stuffed. (Side note: I was very disappointed I couldn’t find a mega-stuffed package at the grocery store because I KNEW they would have gone nuts over that.) I then lined the cookies up next to each other. “Any Questions?” I asked as I handed them each a post-it note.
Excitement buzzed through the room as they posted their questions up on the board and then we sorted them. After talking through all of the questions they decided to work on “Is double stuf REALLY double the stuffing?” I offered to let different groups work on different questions but double stuffing won out! Then, they brainstormed how we could find the answer to our question. Here is what they came up with.
They then decided to break up into teams. Even though there were four teams, it ended up being girls vs. boys. The girls decided to weigh the wafers and the stuffing and the boys decided to build a double stuffed Oreos from the stuffing of two single stuffed Oreos.
The room was a bustle of activity as the students went to work. I was the “official” weigher so I could ensure all of the results were consistent for a good comparison. All groups decided to weigh and measure several cookies (or cookie parts) so that we could get more accurate results. I was very busy with all of the weighing so unfortunately I do not have pictures of this stage. But I promise, it was fun, messy, and mathy!
After they were all finished they shared their results with each other. It was great because all four groups came to the same conclusion. Based on weight, double stuffed Oreos are MORE than double stuffing compared to regular Oreos!
In the end I videoed their conclusions, one representative from the girls side and one from the boys. Unfortunately, my iPhone went wonky and did not record the boys conclusions. this was tragic as they had made their own mega-stuffed Oreo and even had an Oreo dance! Ah, technology!
Thanks so much to the MathTwitterBlogoSphere for making my job so easy! I don’t even have to come up with the ideas – they come to me in my Twitter Feed and GReader (RIP – sigh).
** Edited to say Double Stuf – one f. Seriously, who knew that?
Today I did a lesson with 6th grade called Linear Graphs: Life-Sized Coordinate Pairs that I found on the Teaching Channel. Definitely go there and watch the video. It explains it in great detail!
To do Life Sized Human Graphing put a giant coordinate graph on the floor and then give the kids a rule. They must come up with an ordered pair that fits the rule and then go and stand on their ordered pair.
I taped a coordinate plane on the floor with painters tape. I also had each student wear a dry-erase necklace to write the ordered pair on so everyone could see their ordered pair. They kept saying, “Does my ordered pair work?” I kept saying, “Go graph yourself and see!”. The class stayed engaged the entire time, and were even “overly engaged” arguing about the math at points. I love that. After the first few examples I let them ALL come up and get in line instead of just four or five. I did this mostly because they begged me. They couldn’t wait to get up and see if their point fell on the line!
I used Max’s “noticings” in this as well. They first noticed that they were all in a line. Then they noticed that the line was steeper when it was 2x or 3x. They noticed that 2x made the y-value go up by 2, 3x by 3, and so on. The connections that were made today were amazing and I hope that they carry over tomorrow when I introduce slope (aka rate of change)!
I also made a powerpoint so that the game would be easy to manage. Just click to follow the link and download the file from the Math Wiki. After we start graphing linear equations I want to try Graphing Full Body Style!
I started graphing linear inequalities at the end, with our Knittng Business. For day two, I gave them a foldable that we went over. This day we worked on graphing the lines, then picking and testing their “test points” in class. It went very well as I could refer back to the knitting example with almost every question.
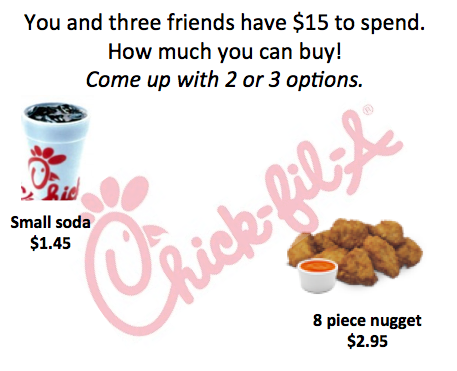
The next day I wanted them to learn how to write inequality equations. I used Chick-Fil-A for this example because they have all of their prices online. I showed them this slide and set them to work with a partner.
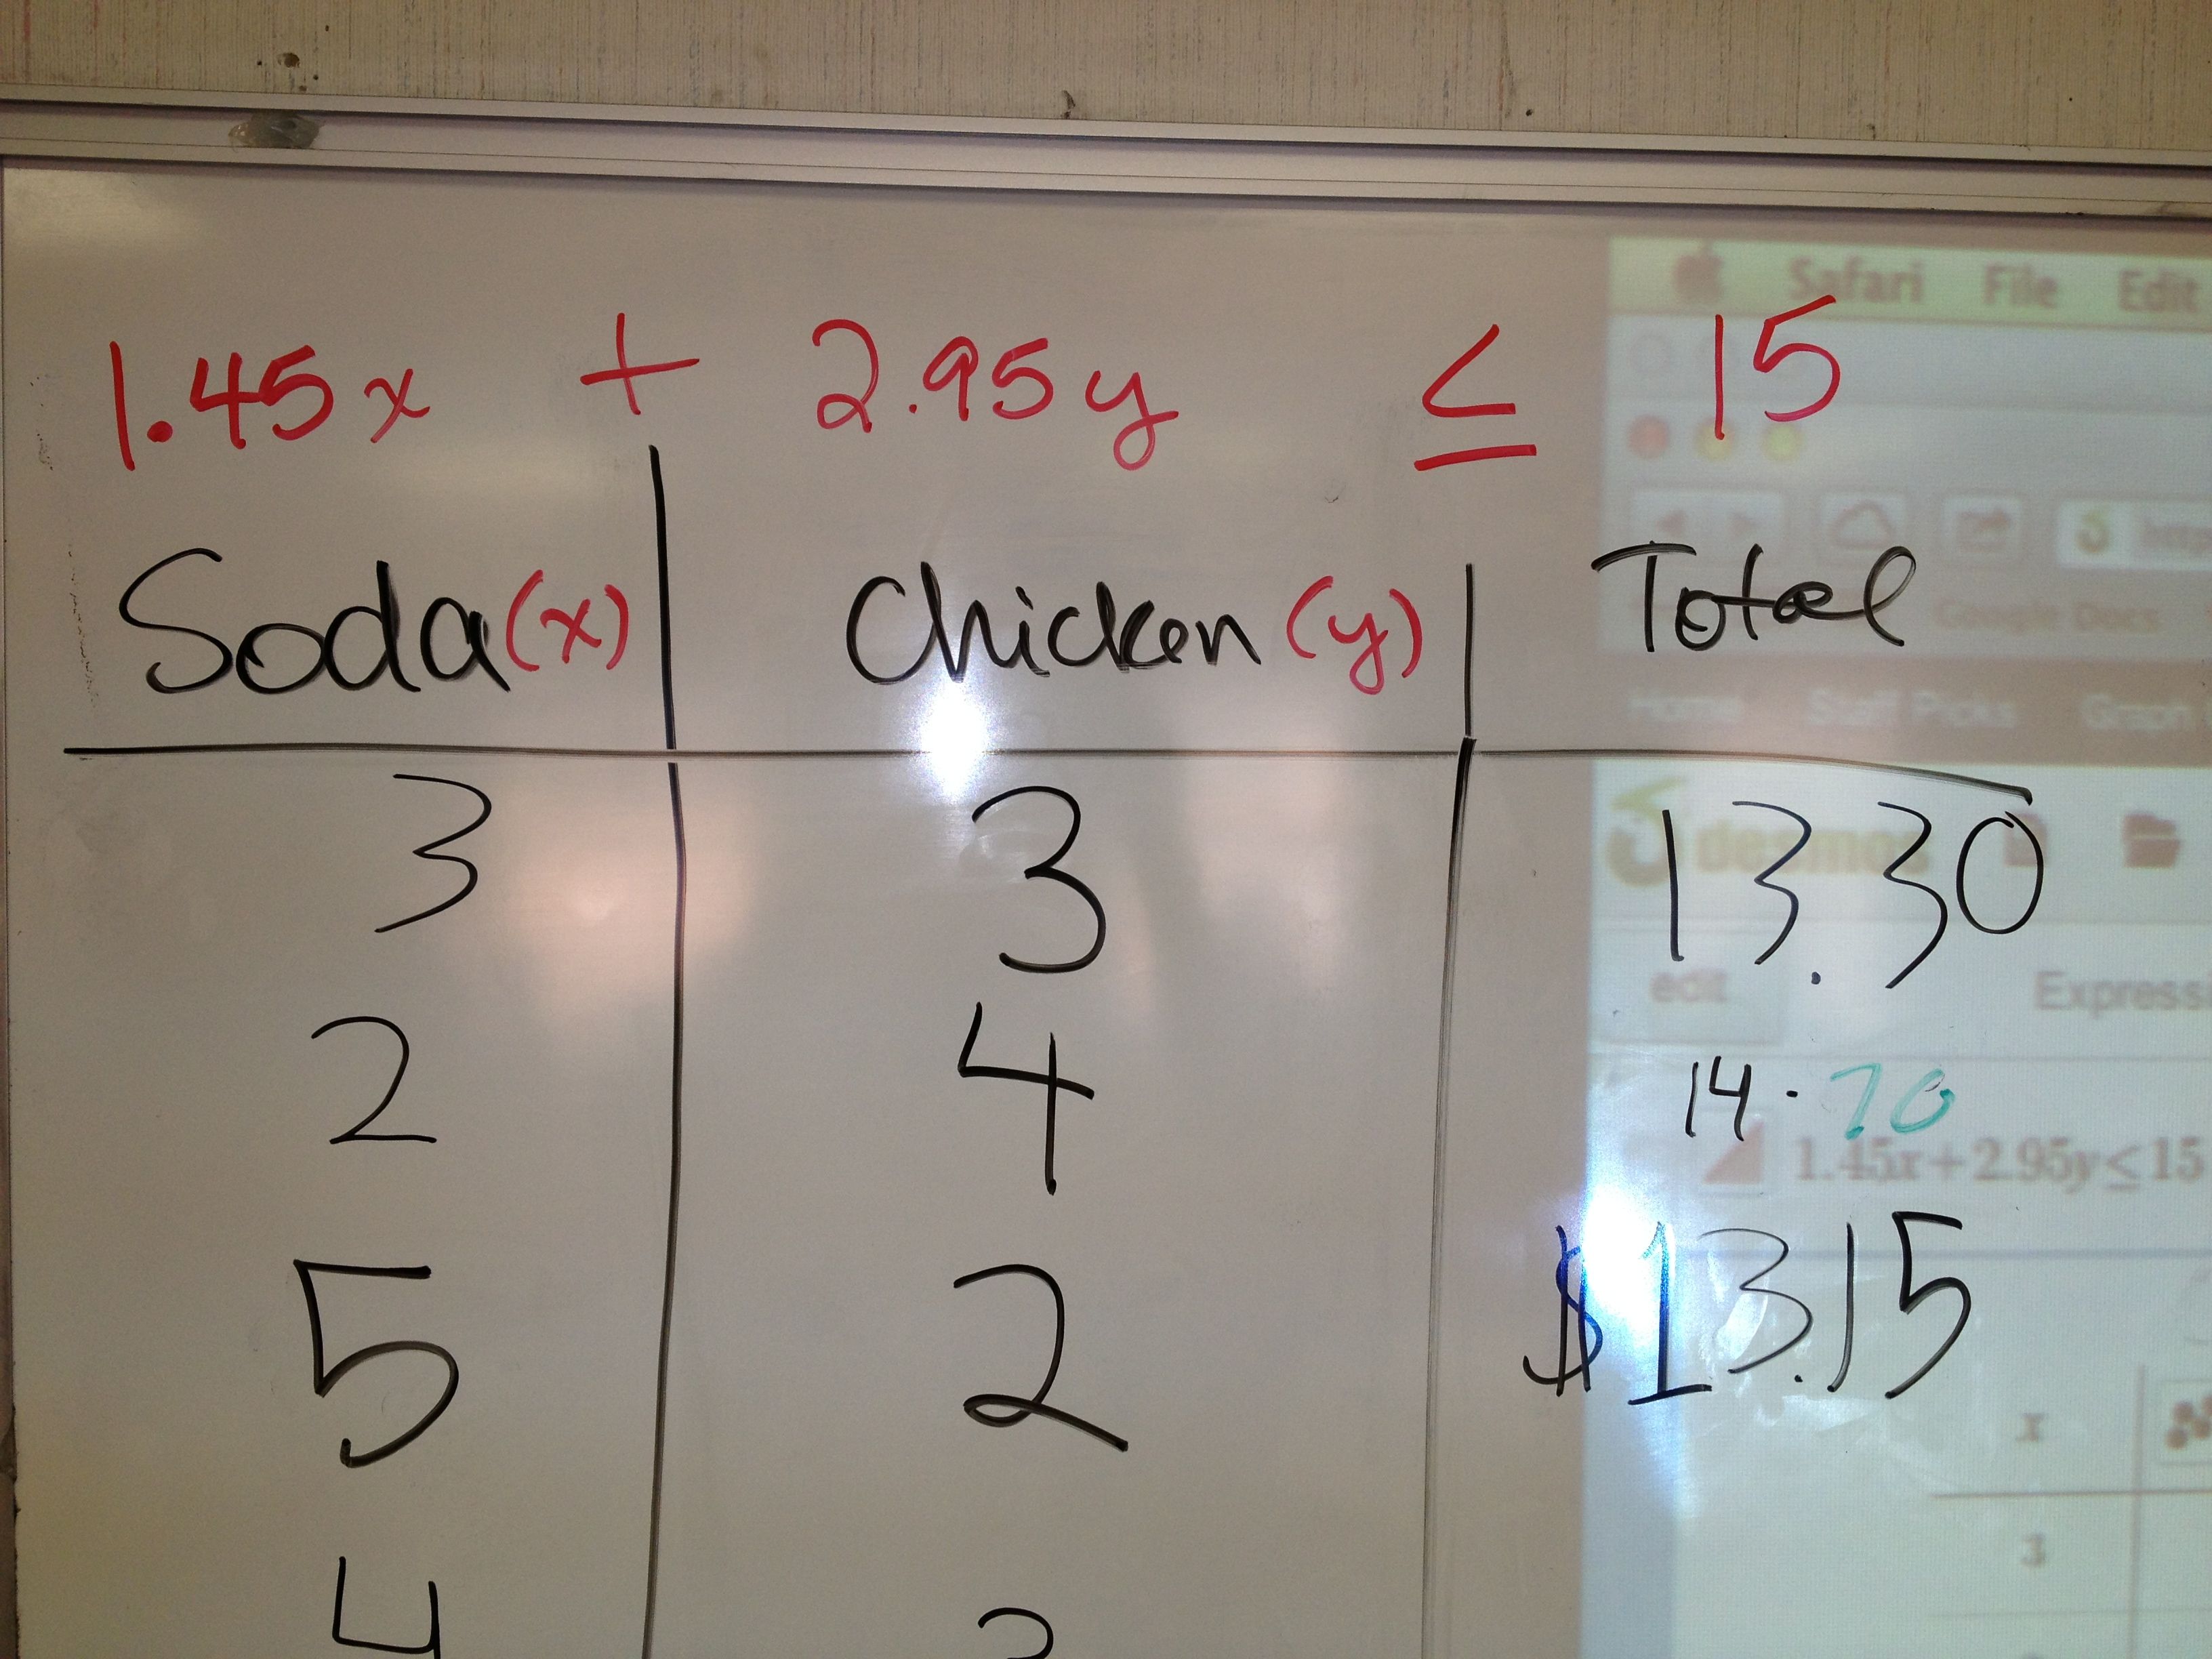
Once they came up with their food and drink combinations, I had them go to the board and enter their information onto a chart.
Once their information was all on the board, I asked them to try and write an inequality for this information. Some groups got it right away. For those that struggled, I gave hints. First, I put the <= 15 on the board between chicken and total. That was all most groups needed. I then asked them HOW they calculated their total. Almost every student was able to write the equation. It was fantastic! I think that the table really helped them visualize the equation. I had not put in the total column before today – but it was key!
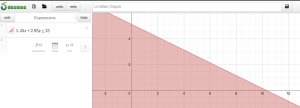
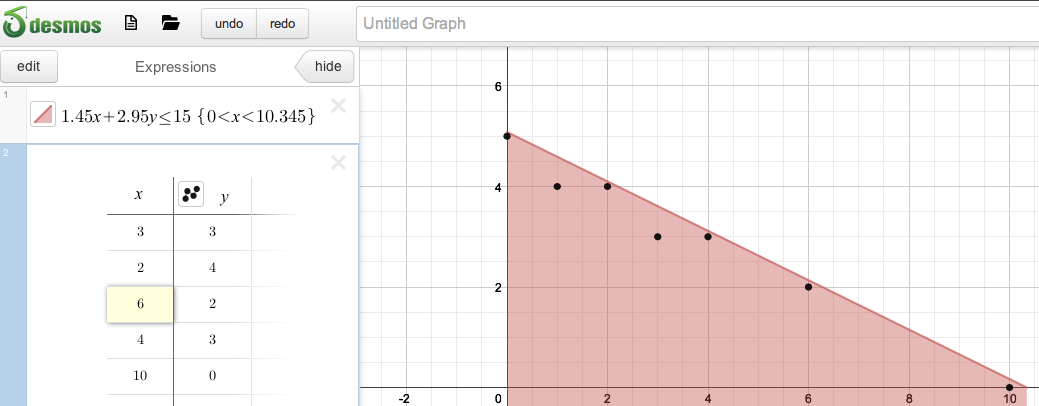
After we wrote the equation we went to Desmos.com and entered the equation with the shading. They love that.
After that, we added a table and then entered all of their food and drink combinations! They noticed that all of the combinations that we entered were actually “test” points. They also saw what it really meant to use a test point and why it was necessary. One group in each class had a wrong answer so they even got to see what happens when you shade one side and then pick a combination that doesn’t work! It was another day of “math-a-magic”!
I’m at MathCounts in Hickory, NC today. I brought 7 6th graders and 3 7th graders. My team consists of four 6th graders. None of these students are even in Algebra. But, they have worked so hard and are so excited about coming today! None of us could sleep last night. I don’t know how they will do since they are so young. These problems are tough for them. They were all quite intimidated when they saw that everyone but them has a graphing calculator. But, none of that matters. They are fabulous, brilliant kids! They are excited to be here and I am so excited for them! Best of all, they requested that we continue math club even after MathCounts! Win for math!
that led me to John’s post about his recent experience with the Barbie Bungee activity. This is a great post, and there is a great discussion going on in the comments right now about how some activities can feel like a recipe and what we can do as teachers to change that. Most of my projects for my first two years were recipes, and I have been trying desperately this year to change that!
Until this year, I had no idea how engaging student wondering, student questions, and student creativity would be for the actual students. I had been reading about it via Dan’s blogany questions (#anyqs) and 3-acts. As a teacher, I know that every lesson needs a great hook to fully engage students. It was not until this summer however, that I actually got to experience this myself, as a student would, through Max’s “Wonderings” session at TMC12. Now, for me “the hook” is not only the hook I would have used before (something interesting to them via an article, multimedia,…), but it also involves student wonderings and questions. Since then I have observed that when students have time to wonder and develop their own questions, they become not only engaged but immersed in the activity. Just by me talking (and instructing) less, and letting them wonder more, my students have naturally become more engaged and interested in the math. They discover that they need to know more math to get to the next step, and this is when I give them instruction. It is instruction during the project as they need it, not before. Activities are projects are not afterthoughts, they are the lesson. When they need the math to figure out their own questions, they work harder and longer, and they actually care about what they are doing. When they create it, they own, and this is where I have seen them grow and learn the most!
I wanted to post this response on my my blog because I have touted the glory of the Barbie Bungee lesson. I posted just the facts, my “recipe”, but I now realize that I left the most important part of my lesson – emphasizing the wondering. With any activity, you have to be careful or it can end up just like a recipe. Looking back, the projects that I have done for the past two years in my classes have been mostly recipes. Since I experienced “wonderings” this summer, I work very hard to NOT let my activities develop as recipes. Sometimes I am successful and sometimes I am not. There is still so much I need to learn, and never enough time!
For Barbie Bungee, I spent almost the entire first class period on “the hook”, “wonderings”, and student questions and creativity. For the hook I showed them the Bungee Videos that they loved. I had them create their own Barbie Bungee Companies but gave them very little directions other than, “Brainstorm things a successful company needs.” From this they came up with company names, company slogans, and company goals. Their goals were like the “any questions” I was hoping that they would come up with, similar to what I have seen come from a “First Act”.
Only after they decided to give Barbie the biggest drop without killing her and started talking about how to estimate the number of rubber bands did I give them the instructions worksheet. I probably could have done this without the worksheet. But, I like that it had the Barbie Bungee slipknot instructions on it. I love to give middle school students opportunities to read and follow directions and knew that consistent results (from consistent rubber band knotting) would help us draw better generalizations in the end. Fawn is considering going without the worksheet next time around. I’ll see how that goes before I jump.
After collecting the data on the jumps, I did not have my students analyze the chart at all. Instead, I had them plot their data. When they did this, they noticed that it correlated and asked me how they could use this to make a better prediction. I instructionally guided them and reminded them of the line of best fit. This led them to their predictions for the test jump.
Another instructional opportunity came after the test jump. When their Barbies hit the ground or fell short, they wanted to know why, and where they had gone wrong. I encouraged them to put this new “test jump” on the data chart and on their graph. This is when many noticed that they needed to adjust their line. Almost every students second test jump was successful. In all of this we did not calculate, we just predicted.
The “BIG JUMP” (13 feet), was more like the beginning of an “Act 3”. Was their math correct? It was exciting because the students loved seeing the Barbies jump – and loved to see their math work! The finale was putting their data into the linear regression calculator, to see how many rubber bands they should have used and how close their predictions had come to the actual math.
I did not end this project with any giant math lesson. In fact, this entire project for me was to create more wondering about linear relationships for our NEXT project where we would need to learn how to do the calculations. Their wonderings were amazing. They wanted to know things like, if they could predict Barbie’s fall with a linear equation, what else out there could they predict? Does this work with anything else? Does this work with everything else? When does this not work? It has led to three subsequent projects and we are starting a fourth in the next week. In this, Barbie Bungee was not an activity in itself for my class, but the hook for all future linear equation work.
In a recent survey I gave my students, they said that they had the most fun with the Barbie Bungee activity, but that they learned the most “math” from our nutrition project (two projects later). That, to me, is progress.
The Barbie Bungee iMovies are finally finished! Barbie Bungee was my favorite activity of all times. There is nothing more exciting then seeing seeing if your Barbie is going to come crashing to the ground. The students learned so much and we ALL had a blast!
I’m not an iMovie expert, but I learned much more about it by making this movie. The text moves way too fast – I wanted stationary text but it kept cutting it off. My students told me they would help me with that. They are only 12 years old, but much better at iMovie than I am! I love them.
I told them they could make an iMovie if they wanted to – totally optional. Three students made movies. I have put them all (and the movie I made) here. Enjoy!!
I know that many people end up their units with a cool, hands on activity. However, I decided to start my Linear Equations unit with one. This was easily the best activity that I have ever done with my students. And, I believe they learned more from it than any other activity.
I saw this activity on Fawn‘s blog, and have wanted to try it ever since! She has a wonderful write up of all of the steps, and even a worksheet that I used (and it is hilarious) so I recommend you go there next to get more information on this. NCTM illuminations also has this in their resources, and it is good to read as well, but I liked Fawn’s version better! I took both lessons and then put my own spin on it, and am hoping to extend it for our study of equations of lines.
I put my students into groups of three and four and then showed them these two You Tube videos. They both are excellent and serve different purposes. One video illustrates how thrilling it would be to bungee jump from the highest place possible. The other video (on Land Diving) illustrates how we DON’T want to hit our heads and even talks about how important the length of the cord it.
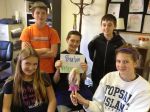
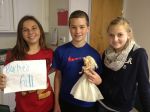
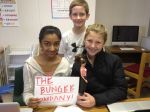
I then told them that they were going to create their own Barbie Bungee Company. I had them brainstorm to come up with a company name and their company goals. Our school is heavily invested in project based learning and I have found that students are much more invested in any project or activity if they come up with the objectives.
Fun names were picked like “Barbie Daredevil” and “Extreme Sky Bungee”. My students had very realistic goals. They all wanted to make more money than their competitors by giving Barbie the MOST thrilling ride, without killing her.
After this was established, I passed out Fawn’s worksheet and they got to work dropping Barbie from 0, 2, 4, and 6 rubber bands. I encouraged them to drop her several times from each and record each drop to get greater accuracy. Some groups listened and some did not. They did not yet realize the importance of accuracy. I would let them drop her from no more than 6 rubber bands to get their line of best fit.
At this point I added from Fawn and NCTM’s lesson in order to more thoroughly analyze their lines of best fit before the big drop. I am go glad I added this part as it ended up being the part of my lesson where the most learning occurred. Our final Barbie Bungee was going to be a drop from 160″. However, I first wanted them to use their line of best fit to do a “test drop” from the ceiling of my classroom, at a height of 94″. We talked about “market research” with businesses, and how important testing from 94″ was before we went to 160″.
I had each group make their prediction of how many rubber bands they would need to safely drop Barbie from the ceiling. This information needed to be kept TOP SECRET so that the other groups would not steal their companies ideas. They really got into this and my usually loud group work classes were full of excited and hushed whispers.
During the test drops, only one groups Barbie had a very thrilling ride (close to the floor without hitting) the first time. Most groups either hit the floor or were not close enough to the floor. I sent those groups back to the “prediction” drawing board. This is where most of their line of best fit learning took place. They knew they either needed to add or take rubber bands away. However, I had them look at this on their graph so they realized their line of best fit was off. Only after they adjusted their line of best fit, would I let them retest. I emphasized that they should not be guessing how many rubber bands to take on or off, but predicting the number by adjusting their line of best fit.
After they readjusted their line of best fit and made a new prediction, I let them test again. Most of the groups were much more successful on their second test drop. I had them measure how far Barbie came to the floor so that they could add this new data point to their graph. At this point, some groups noticed that she fell further than they had predicted, and slightly adjusted their line of best fit again.
Next it was time to make their predictions for the 160″ drop! I had told them that they would be dropping Barbie 160″ but did not give them much instruction when they were creating their original graphs. Therefore, some groups had to redraw their graphs (or add more paper) to extend their graph to 160″. This was an excellent learning experience as well! After they made their predictions, “locked it in” on a sticky note, and added the rubber bands to Barbie, it was time to do the big drop!!
The big drop was very successful and EXCITING. We videoed each drop – and their excitement as well as the things they said were priceless. The You Tube playlist is at the end of this post. Only one group had a major Barbie fatality. Two of the three groups were very, very close and we had to drop her several times to make sure that she hit the ground. One group is still in heated contention. I love it when they argue about the math! Two groups dropped her dangerously close to the ground without hitting. It was a thing of beauty!
After we dropped our Barbies, we went back in to analyze the math. I had them enter their first 5 data points (for the 0, 2, 4, 6 and test drop rubber bands) into an Alcula linear regression website. This site was GREAT as it graphed their data, gave them a regression line, and then let them enter rubber bands (x-axis) to see how many inches Barbie would dropped based on their line. This was when the real magic happened. When the closest group entered their rubber bands, the math returned 159.4″. They were thrilled.
The day after the Barbie Bungee was the last day of school before Christmas break. So, I gave them the option of using the videos we took of Barbie Bungee to make iMovies. All of the students jumped at that! Two of them even finished their iMovie in class. Some of my students are very skilled at iMovie! As I get more of their iMovies, I will post them back here. This was completely optional for my students. Some some added more details, and some focused more on Barbie’s exciting drop! I had two groups ask me if they could do a Powerpoint or Prezi instead since they weren’t great at iMovie. I love that they wanted to do any of it! I plan to make my own iMovie – if I can find the time. I am sure it will not be as clever or inventive as my students movies however!
For the next step I am going to use these graphs to explore what each piece of their regression line really means. Hopefully, they will understand what a y-intercept is because of Barbie’s height and realize what the coefficient with x means because of the inches they were trying to reach with added rubber bands.
I had each of them answer reflection questions on a Google Doc. The questions included asking what they could have done to have a better drop and what advice they would give to next year’s students. They had great advice! Here are some of my favorites.
“For next year’s students, I would tell them to be very careful when graphing and drawing their line of best fit. They should have fun, but be diligent with their work at the same time.”
“I wish we could have redone our graph more accurately. Make sure to be organized, and keep all supplies and papers together. You also really need to follow directions and stay on task.” (This group had the major Barbie fatality).
“Do not rush to finish first, take a good amount of time to guess 94” and 160” because the guesses is what Barbie’s fate is based upon.”
“We could have used that website and then we would be more accurate. Take your time when drawing the line of best fit and measure right.”
“To be more accurate, we could have done more test drops and used more exact measurements when Barbie was bungeeing. Test your barbie several times and go through all of the math 2 times just to check for any math errors.
I LOVE Math Stations and wrote all about them before. For easy stations, you can make fabulous math stations in a fraction of the time by simply cutting up a worksheet into 5 or 6 pieces.
Materials Needed:
1 Math Worksheet
1 Answer Key
5/6 sheets of different colored paper
1 Station Word Foldable** ** This is totally optional as students can simply do the work in their notebooks.
First, I find a worksheet that has all of the topics I am interested in working on. My “teacher edition math book” is of course FULL of these. I print off the Station Templates onto colored paper and cut them in half. (One half is to glue the questions on, one side is to glue the answers on.) I cut the worksheet into 6 pieces and then glue stick them onto the Station Templates. I glue stick the answers onto the matching colored “Answer” sheets and fold them in half. I insert the Stations into clear picture frames for easy viewing (and sharing) and then tape the answers up in a central location.
Viola! I have quick and easy, color coordinated Math Stations. The students get tons of practice while moving around the room. I can help students that need it. The kids love them, I love them. Everybody wins! 🙂
I teach 6th and 7th grade math so I get my students for two years in a row. The beginning of 7th grade year is a review of their entire 6th grade year. It’s fabulous because I get to go pretty fast through the material and only focus on what they need. I don’t usually need to teach the entire lesson again and they did the discovery activity the year before. This leaves plenty of time to practice, practice, practice!
This year I’ve had much more fun than ever before with in class practice thanks to the great math teachers at TMC12. This summer I learned all about their favorite things, many of which included fun ways to practice.
I have found that practice is more effective when I put kids in groups or with a partner and either play games or do a fun activity. I never, ever just give them a worksheet to work on.
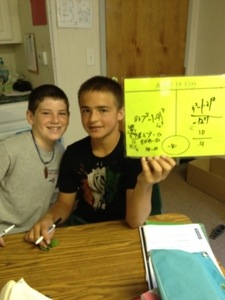
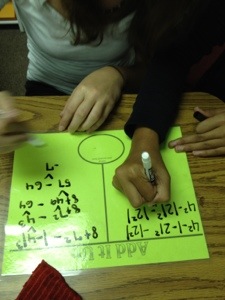
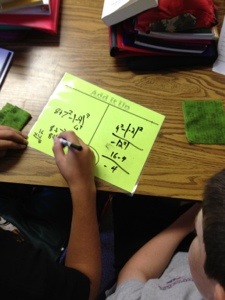
Right now my favorite activity is Rachel’s math “placemats”. I made a dry erase template for the activity and called it “Add It Up”. All you need to play is a worksheet and a template. You can use any worksheet that you have. To play, two or four students work on individual problems and then add the sum up and write it in the middle. I check the sum. If it’s correct, they move on. If it is incorrect, they don’t know which problem is incorrect. I usually tell them to work each others problem.
This is a great way to differentiate. I usually have the students work with students that work at the same “pace” as they do so one student doesn’t get frustrated. Everyone can thus work at their own pace. Quicker students move from the easier problems at the beginning to the work difficult ones. And, I put incredibly difficult problems at the end. It’s the one day when I can really challenge my highly gifted students. I can also take time to sit with my students that need more help and do some re-teaching.
My other favorites are games. I’ve had the kids play Zero lately with cards and they love it. I’ve also made block games (from Cheesemonkey) this year and puzzles. I’m using a puzzle for the first time in two weeks as a challenge exercise so I’ll see how it goes!
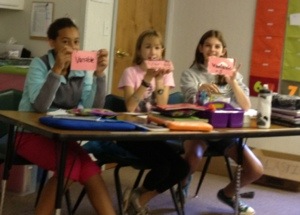
Last year when I taught algebra vocabulary I hated my lesson. To make matters worse, many of my kids still don’t know all of the terms. This year, I decided to spice it up! I wanted to make them active participants in the lesson by using our new dry-erase index card necklaces, a small graphic organizer, and of course COLOR!
Their homework assignment was to make colorful flashcards of their vocabulary words for a game tomorrow! I made a flyswatter vocabulary game for tomorrow that I will share in my next post (after I use/proof it in class). I want them to see how relevant their homework is in class the next day! We also made a pocket to hold their flash cards by taping a yellow index card into their notebooks on the vocabulary page.
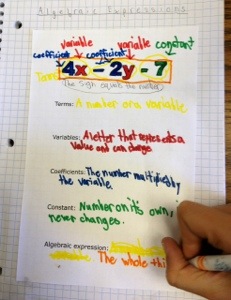
I had each table group write a vocabulary word of the day on their necklaces. For instance, table 1 all had the word “variable” written on their necklaces. The words were variable, coefficient, constant, term, and algebraic expression. I than passed out a small graphic organizer with a large algebraic expression at the top and the same five words typed below. I then hi lighted a part of the algebraic equation and had them think about and discuss with their table groups which vocabulary word that part may be. After educated guesses, I called out the answer and told “Variables to please stand up, please stand up, please stand up!” They had fun guessing and jumping up. After we defined the new vocabulary word, I had them color in the correct part of the algebraic expression. We did this for all five of the vocabulary words.
It was a very fun day and I loved how much the kids got into their name tags this time! I think making them “mystery vocabulary words” really helped!


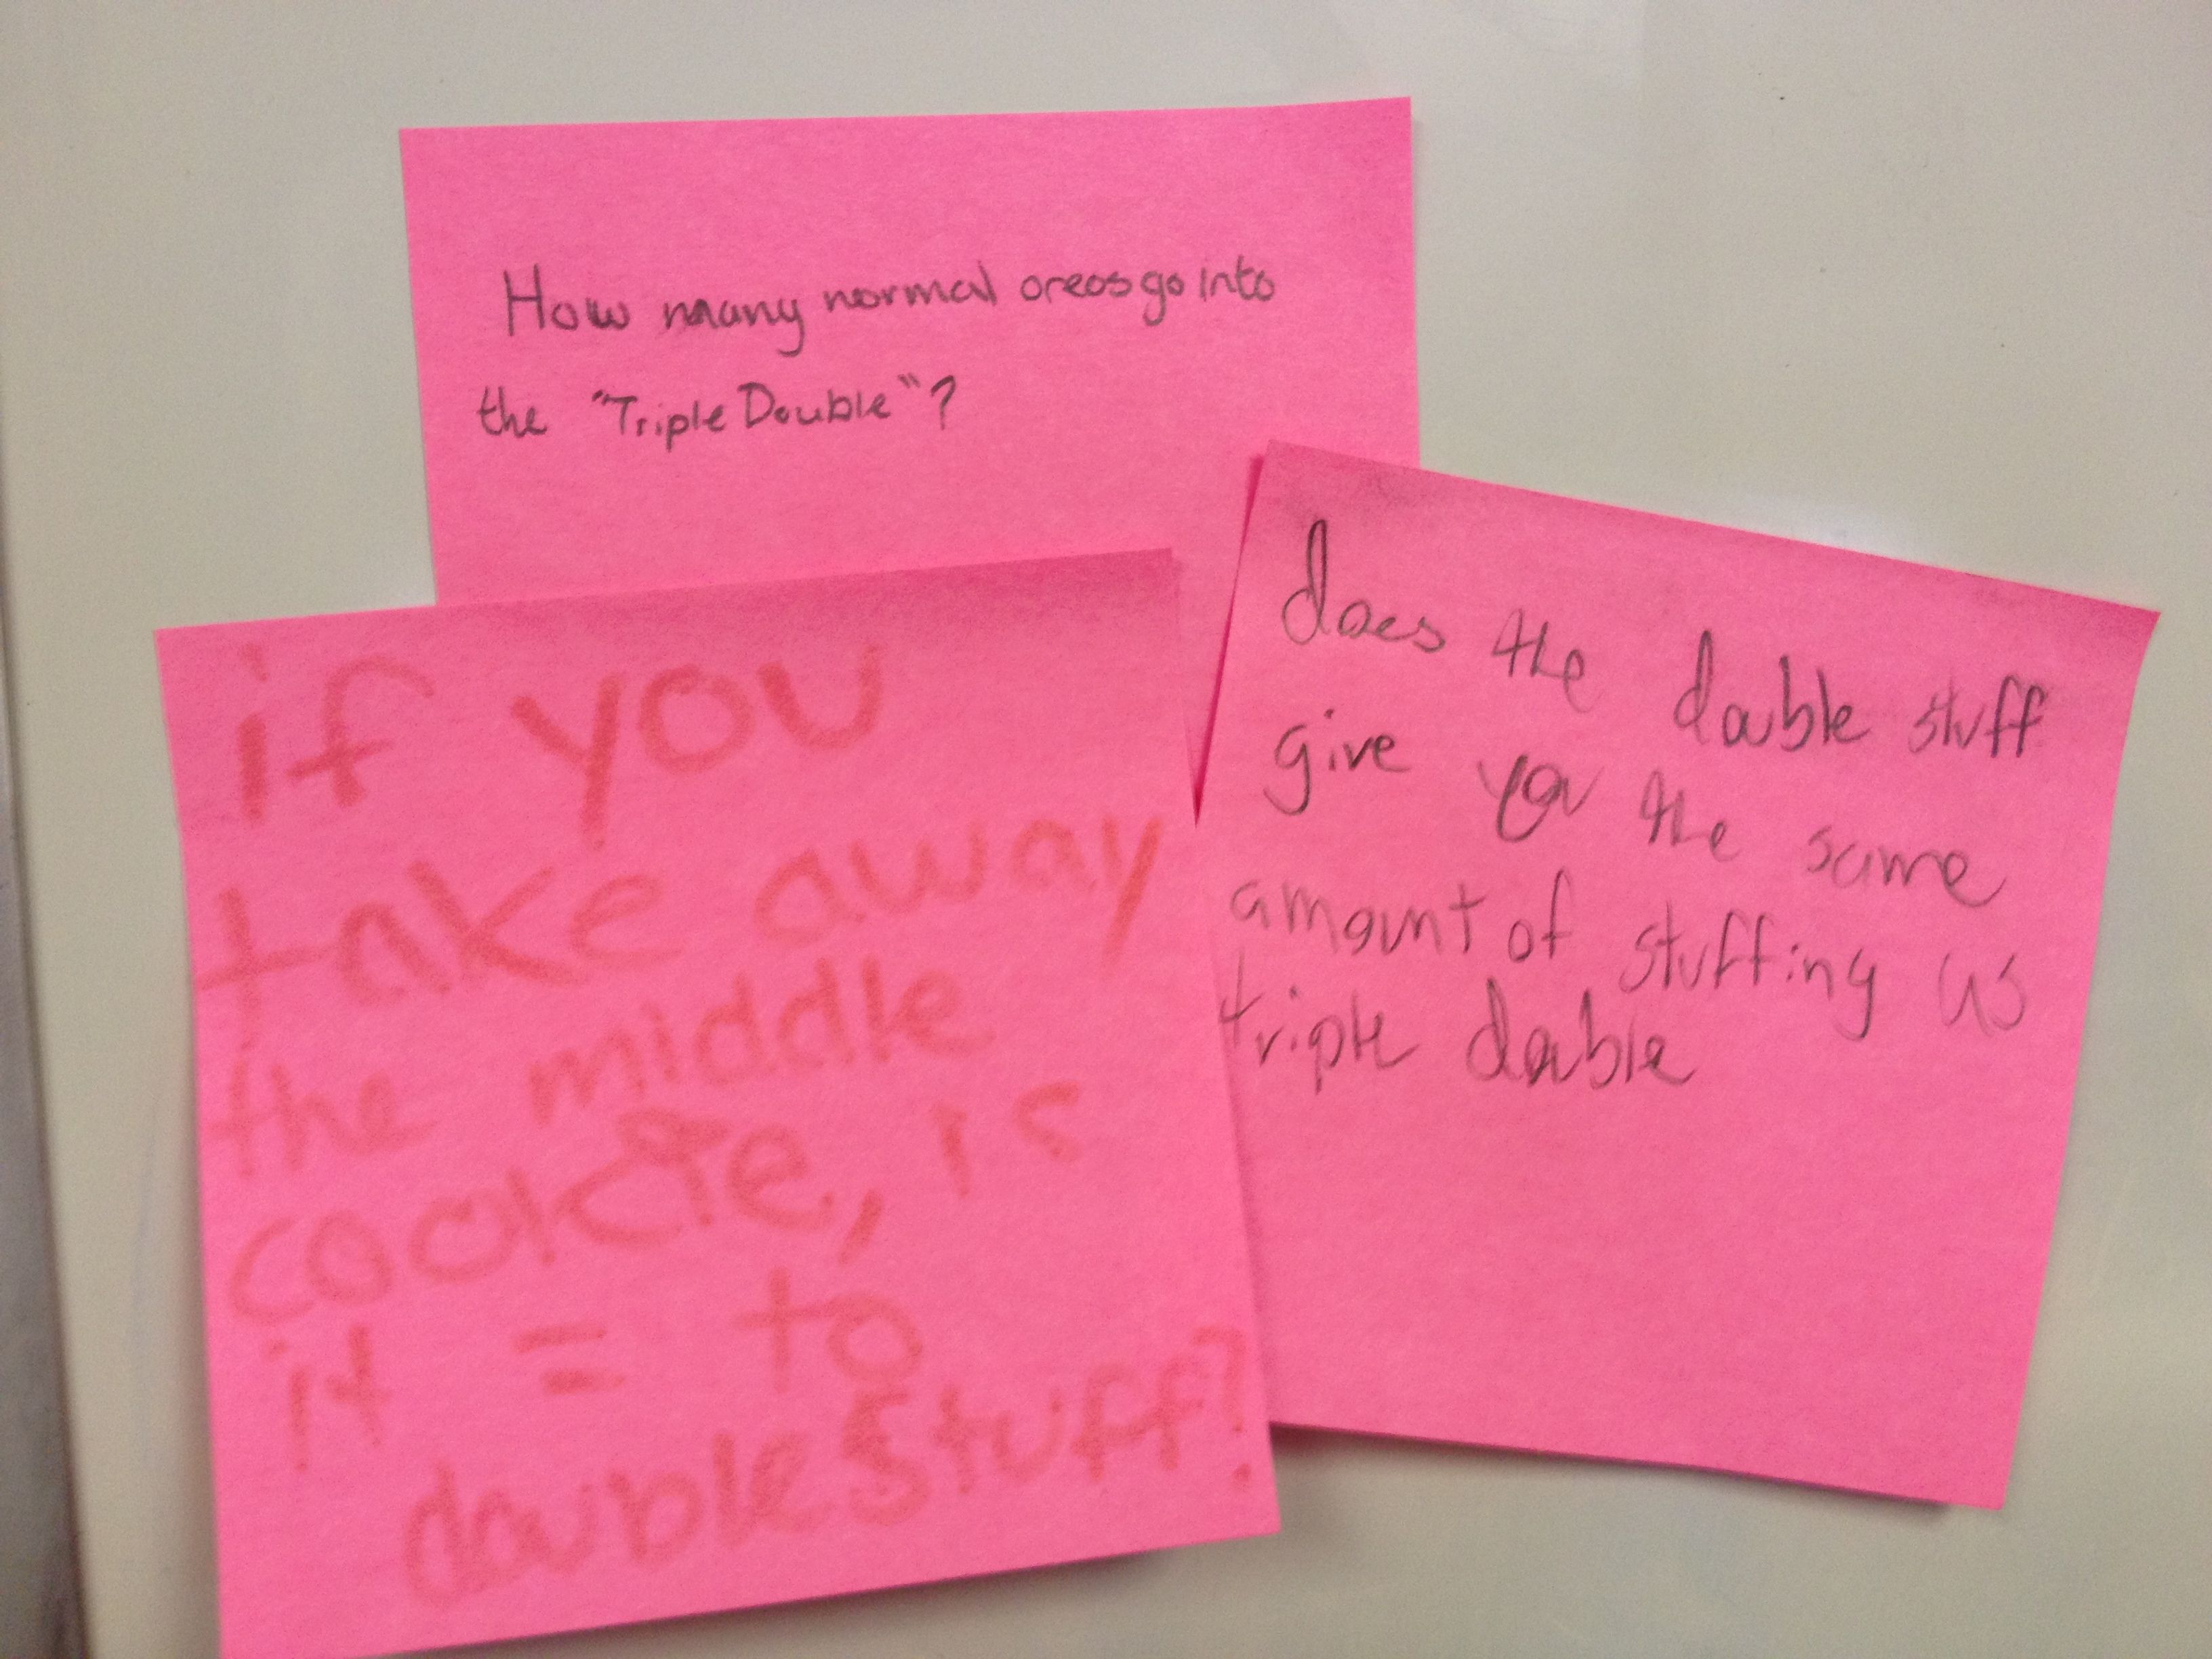 After talking through all of the questions they decided to work on “Is double stuf REALLY double the stuffing?” I offered to let different groups work on different questions but double stuffing won out! Then, they brainstormed how we could find the answer to our question. Here is what they came up with.
 They then decided to break up into teams. Even though there were four teams, it ended up being girls vs. boys. The girls decided to weigh the wafers and the stuffing and the boys decided to build a double stuffed Oreos from the stuffing of two single stuffed Oreos.
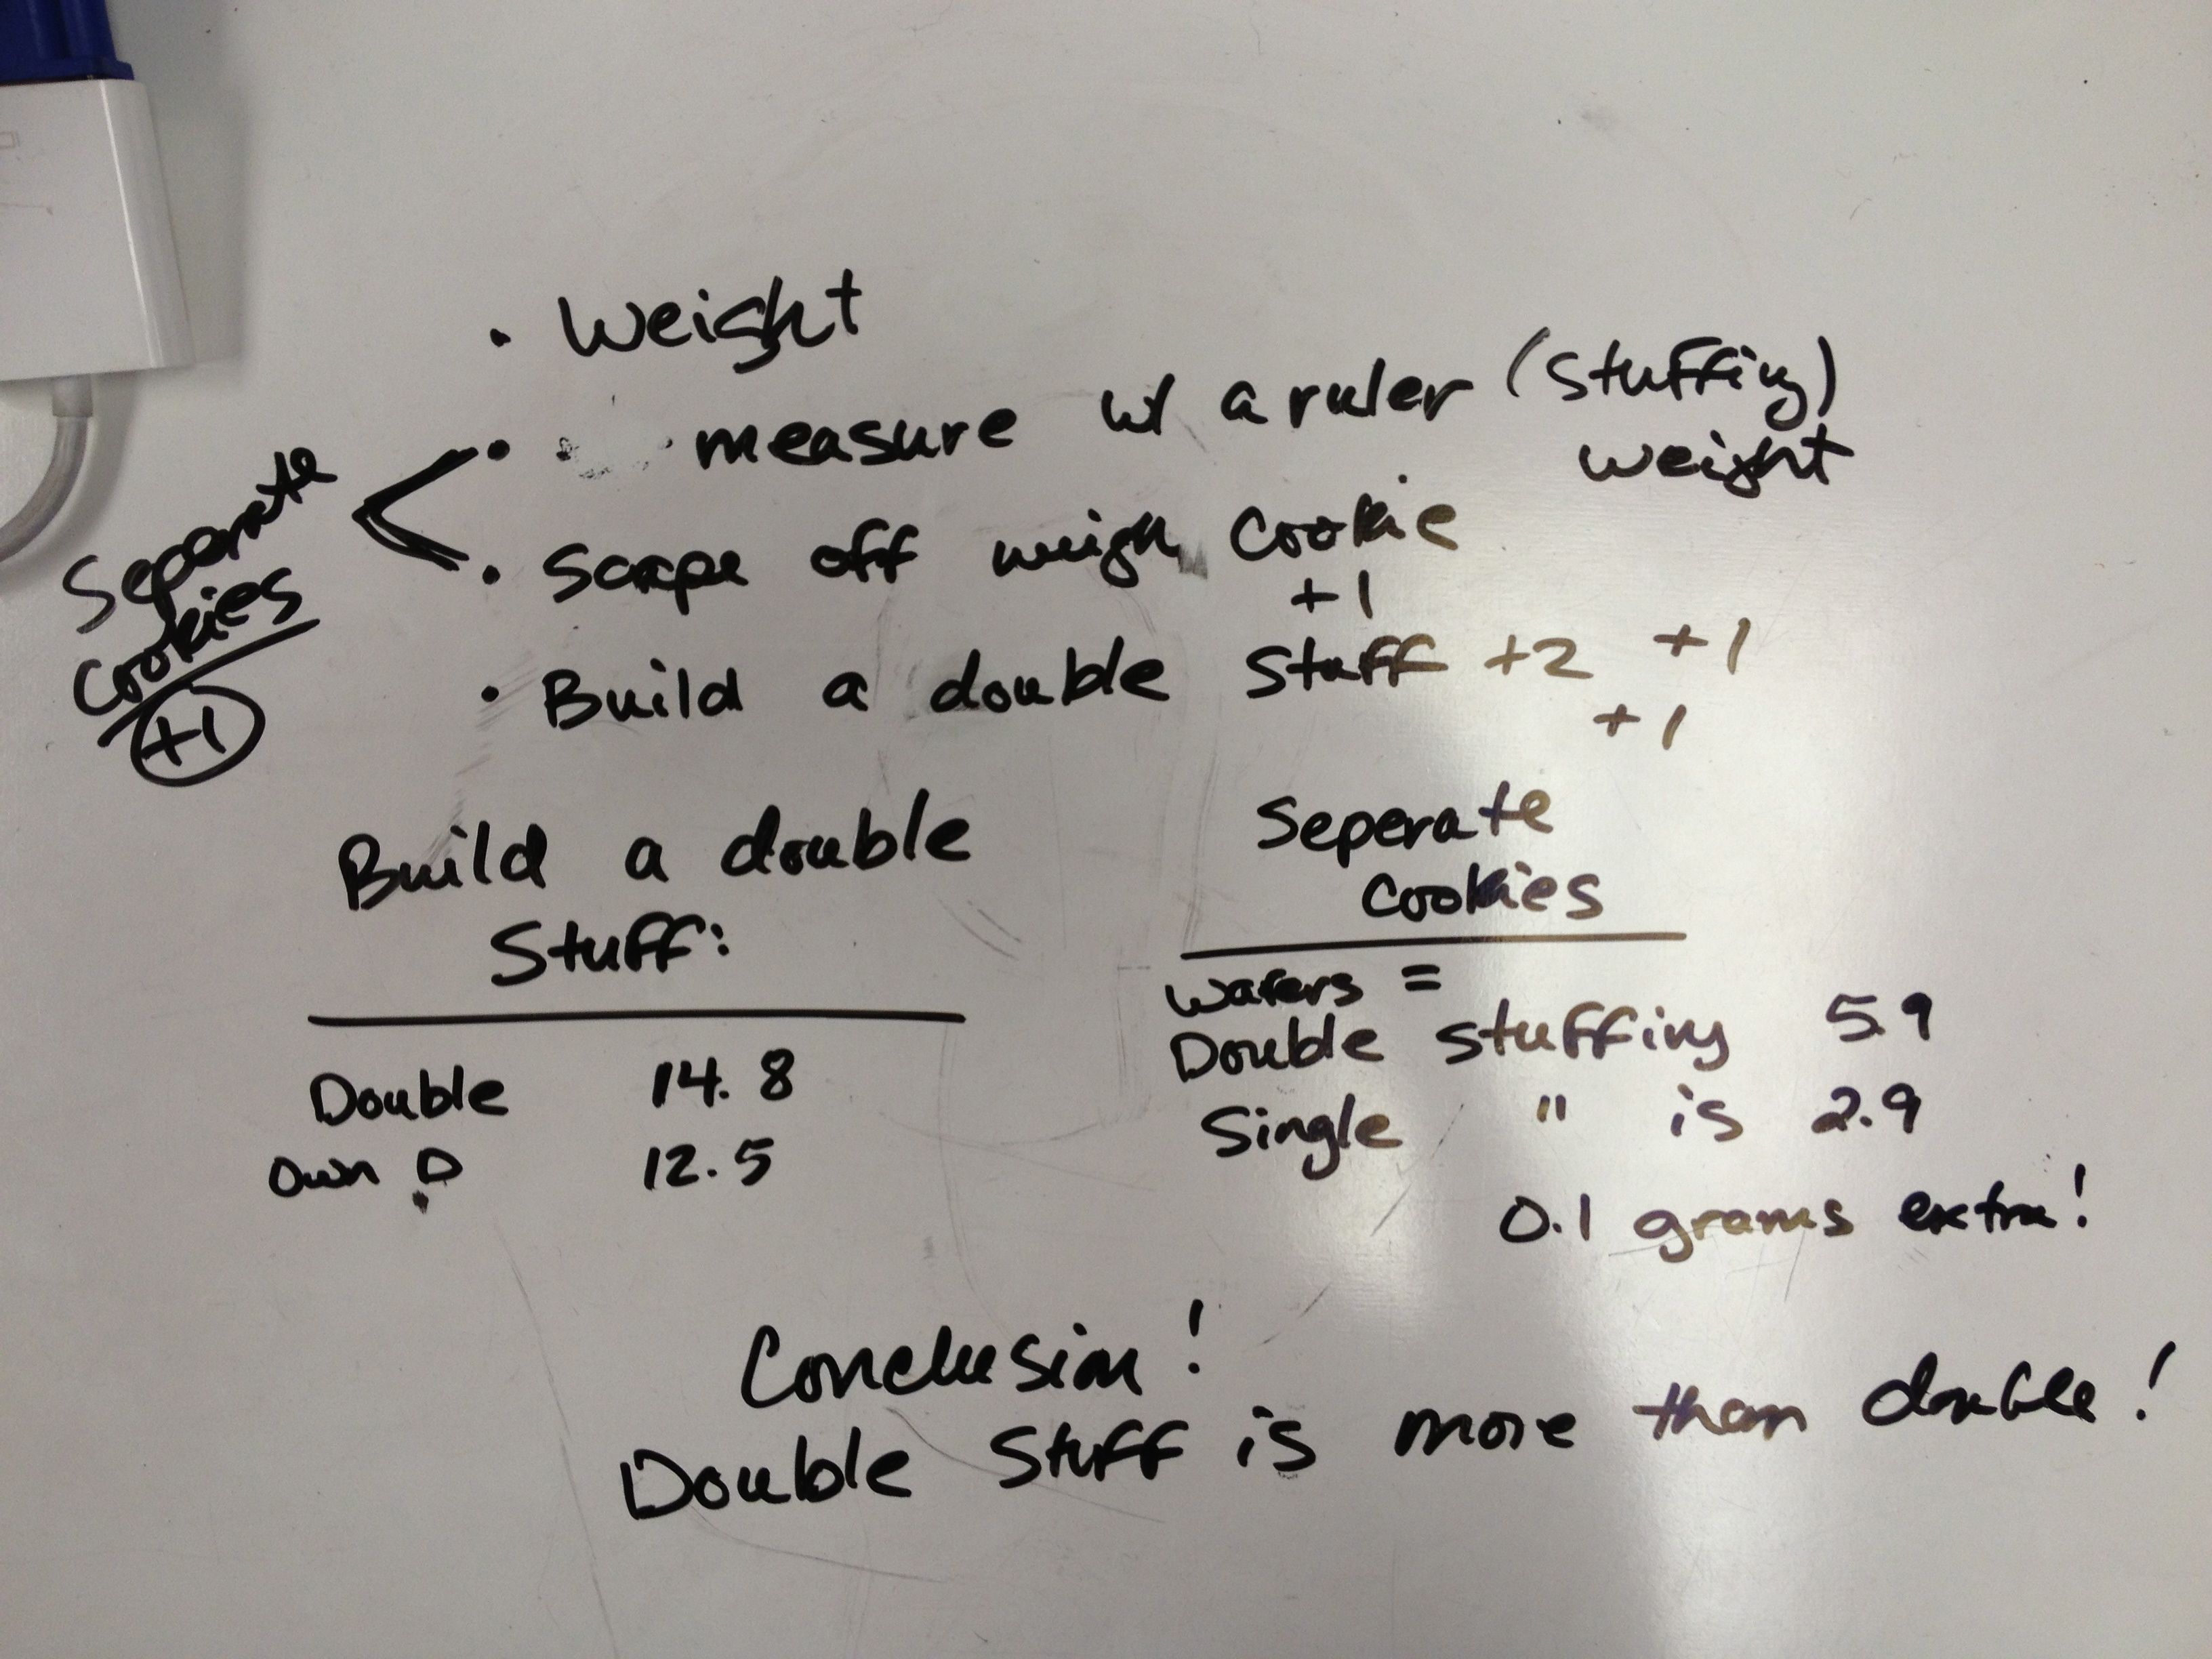


